
Data Explorer is the report you build yourself from your workspace’s tracked data. Pick the columns, group the rows up to four levels deep, filter, chart and export the table, then save the setup as a view to open again. It sits beside the other reports and replaces none of them. Everyone in the workspace opens it from Reports > Data Explorer, on every plan. Saving views is on the Plus and Premium plans.
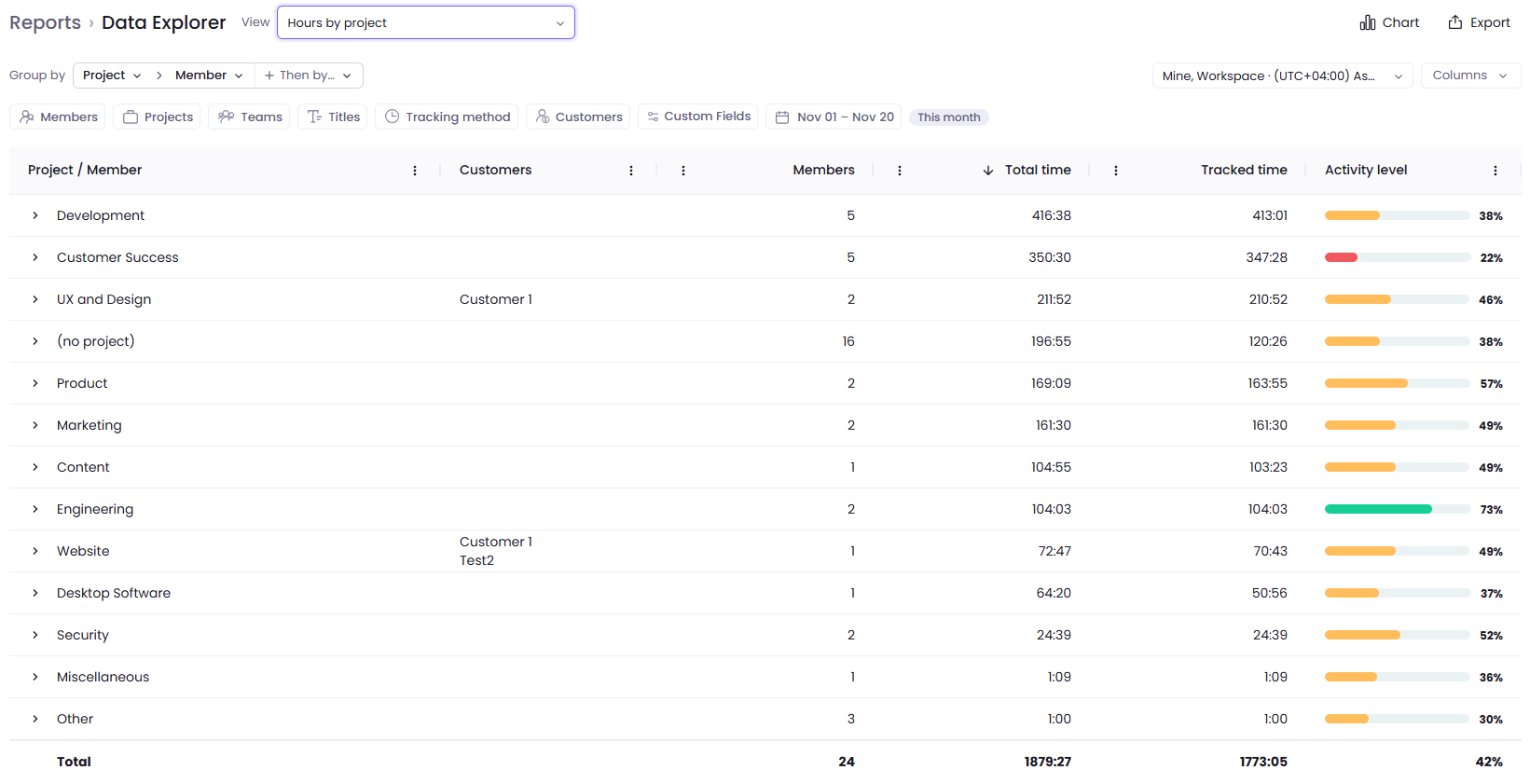
Each role sees the time it sees in the other reports. The Workspace Owner and Executive Managers see the whole workspace. Team Managers see their own time and the members they manage. Project Managers and Project Viewers see their own time and the projects they have access to. Members see their own time.
Start from a ready-made view
The page opens on the view you used last. Open the View menu to switch: your saved views are under My views, and nine setups are under Ready-made views.
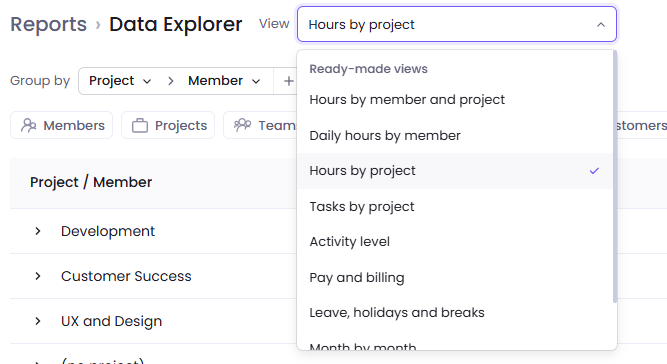
| View | Rows | Dates |
|---|---|---|
| Hours by member and project | Member, then Project | Last 7 days |
| Daily hours by member | Member, then Day | This week |
| Hours by project | Project, then Member | This month |
| Tasks by project | Project, then Task | This month |
| Activity level | Member, then Project | This week |
| Pay and billing | Member, then Project | This month |
| Leave, holidays and breaks | One row per member | Last 30 days |
| Month by month | One row per month | This year |
| Manual and idle time | One row per member | Last 30 days |
Pay and billing shows only to people who can see pay or bill rates. A ready-made view can’t be renamed or deleted. When you change one, Edited and Reset appear: Reset opens the view as it was, and your change can be saved as a new view of your own.
Switching to another view or clicking Reset drops the changes you haven’t saved, without a warning.
Group the rows
Grouping puts rows inside rows, up to four levels deep, from Member, Project, Task and Day, in any order.
- Click Group by and choose the first level. In a view that already has levels, go to the next step.
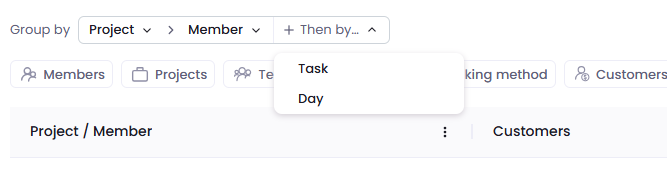
- Click Then by… and choose the next level.
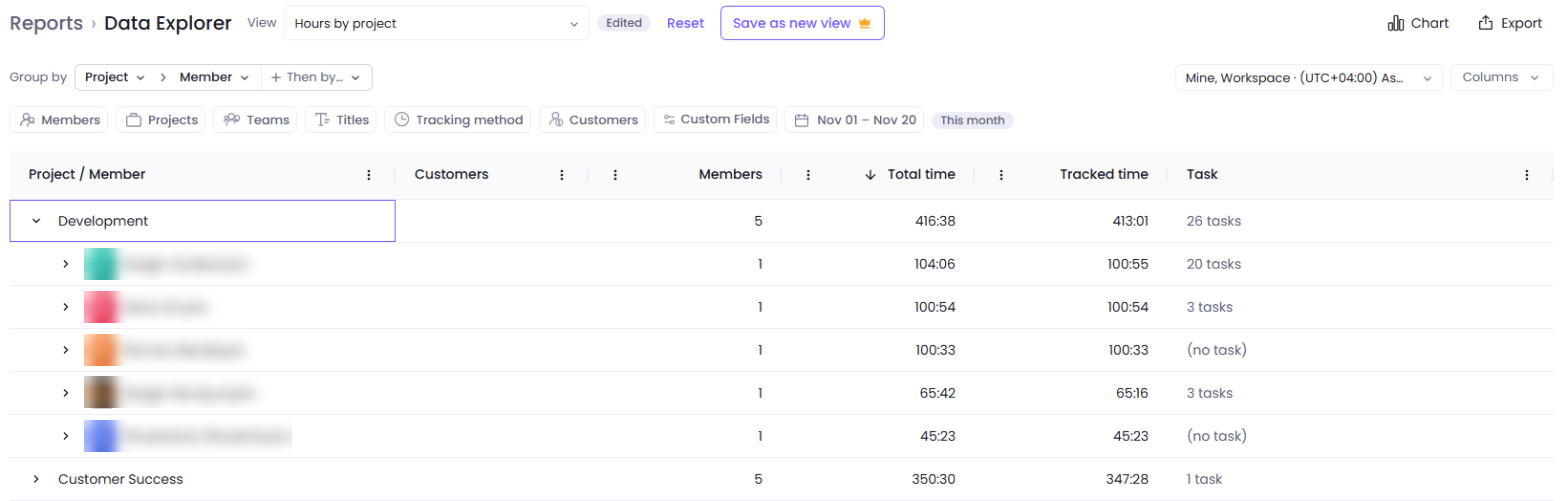
- Click the arrow next to a row to open the rows inside it.
Note that while Day is a level or a column, Date unit switches it to Day, Week or Month.
Each row counts for itself. Members and Days worked on a parent row count each member and each day once, so they can be smaller than the sum of the rows inside it. Both count any recorded time, so a day with only leave, holiday, break or idle time counts in Days worked.
Show the Member, Project, Task or Day column without grouping by it to count it. With the rows grouped by Project and the Task column shown, each project says how many tasks it holds, such as “26 tasks”.
With no level, the table has one row for each combination of the Member, Project, Task and Day columns you show.
Choose the columns
- Click Columns. Type in Search columns to find one.
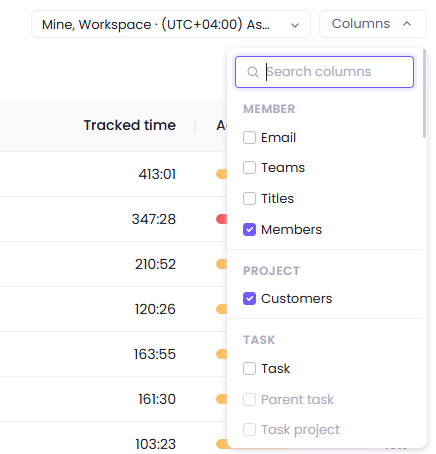
- Select a column to show it, or clear it to hide it.
- Drag a column header to move the column.
| Group | Columns |
|---|---|
| Member | Member, Email, Teams, Titles, Members |
| Project | Project, Customers |
| Task | Task, Parent task, Task project, Status, Due date, Time estimate |
| Day | Day, Weekday, Days worked |
| Time | Total time, Tracked time, Manual time, Idle time, Break time, Leave time, Holiday time, Inactive time, Time outside working hours |
| Activity | Activity level, Mouse, Keyboard, Scroll |
| Pay and billing | Pay amount, Bill amount |
| Custom fields | Your member, project and task fields, except large-text fields |
A column that describes a member, project, task or day needs that column. Parent task, Task project, Status, Due date and Time estimate stay grey until Task is a level or a column. Email, Teams and Titles need Member, Customers needs Project, and Weekday needs Day.
Total time adds up tracked, manual, idle, break, leave and holiday time. When a total differs from another report, see Why do totals differ between views and reports?
Click the three dots in a column’s header to sort it with Sort Ascending or Sort Descending, or to pin it left or right with Pin Column.
Reset Columns in the same menu puts the columns back as they were when you opened the view, or last changed the grouping or the Date unit. It undoes the columns you showed, hid, moved or pinned since then, the sort and the widths.
Some columns show only to some roles:
| Column | Shown to |
|---|---|
| Pay amount | People allowed to see pay rates |
| Bill amount | People allowed to see bill rates |
| Pay amount and Bill amount, for everyone | Only while Settings > Features > Billable / Payable Hours is on |
| The Workspace Owner, Executive Managers, Team Managers and Project Managers | |
| Time estimate | Every role except Members |
| Customers, and the Customers filter | Every role except Project Viewers |
| Custom fields, and the Custom Fields filter | Every role except Members, on the Plus, Premium and Legacy plans. Project Viewers get no member fields |
An amount shows with its currency. When members are paid or billed in several currencies, a row splits by currency, and the totals list one amount for each.
Filter the report
The filter row narrows the table: Members, Projects, Teams, Titles, Tracking method, Customers, Custom Fields and the dates.
- Dates: up to 366 days. Pick the dates, or a shortcut such as This Week, Last 7 Days, Current Month or This Year.
- Tracking method: how the time was recorded: Desktop tracker, Mobile tracker, Web tracker, Extension tracker, Manually added time, Idle time, Paid leave, Break, Paid holiday or Kiosk.
- Time zone: the menu next to Columns sets the zone the days are counted in: yours, the workspace’s, UTC or any other. It starts on the workspace’s time zone, or on yours when the workspace has none.
Chart and export the table
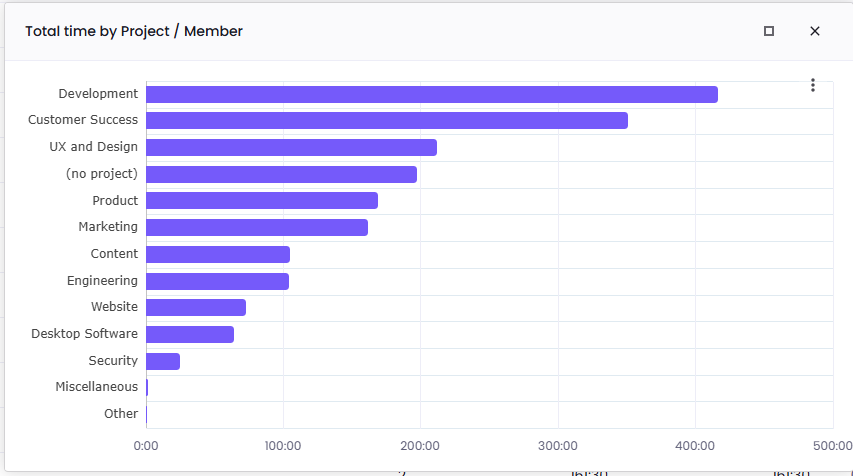
Click Chart to draw up to 15 top-level rows as bars. The bars measure the number column you sort by, or the first number column shown when you sort by name. When each row is one day, week or month, oldest first, the chart is a line of up to 30 rows. The chart’s menu holds Edit Chart, Advanced Settings, Link to Grid and Download Chart.
Chart stays grey until the table shows a number column and has rows.
Click Export and choose CSV or XLSX. The file holds every row of your setup down to the last level, a subtotal line under each group, and the totals at the end. An export holds up to 100,000 cells, rows times columns; for a larger table, shorten the dates or hide columns.
Data Explorer has no PDF, share link, email or schedule; the other reports have them.
Save a view
A saved view keeps your columns and their order, levels, date unit, sort, pinned columns, filters, dates and time zone. Only you see it. Saving views is on the Plus and Premium plans.
- Change a ready-made view.
- Click Save as new view.
- Enter a View name and click Save.
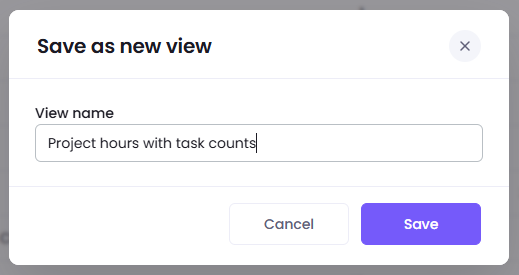
The view opens under My views in the View menu. You can keep up to 50 views in a workspace, each with its own name. A view saved on a shortcut such as This Week moves with the calendar. Dates you pick stay fixed, unless they match a shortcut’s dates on the day you pick them.
When you change a saved view, click Save to update it. To keep both, choose Save as new view in the … menu next to the view’s name. The same menu holds Rename and Delete.
You can’t restore a deleted view that you created and have to create it from scratch.
On plans where saving a view is not available, views you saved before still open, and you can delete them, but you can’t rename or update them.
Was this article helpful?
Thanks for your feedback.