
To view the Tasks report in WebWork,
- In your dashboard, go to Reports > Tasks
Here you can view how much time was tracked on each task, which member tracked time on it, date, duration, and more that you can enable from columns.
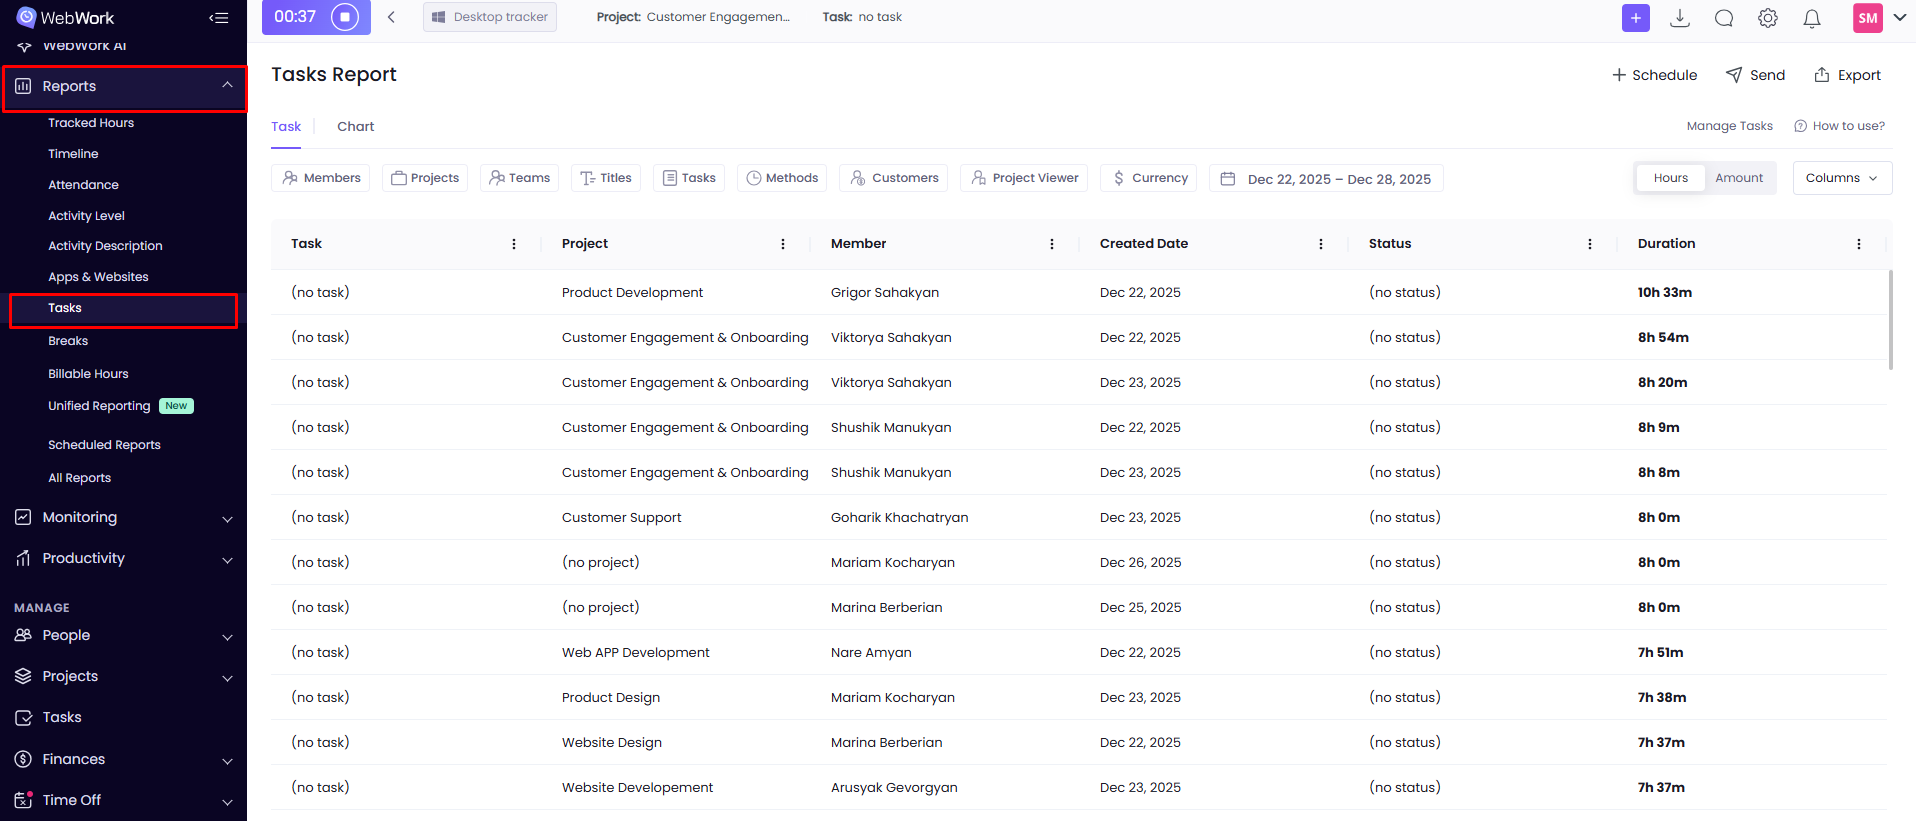
Switching between hours and amounts
By default, the Task Report will show tracked time data for each task. You can also change the view the Amounts from the top left corner to see how much was earned when tracking time on each task.
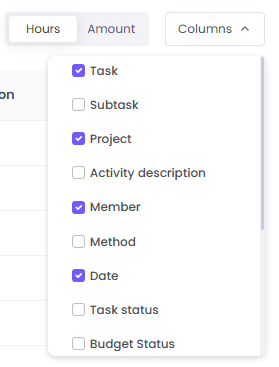
Columns
You are free to select what columns to see in the task report. Click the Columns dropdown and select the data you want to see.
To see how time was tracked, switch on the Method column under Columns. It is off by default.
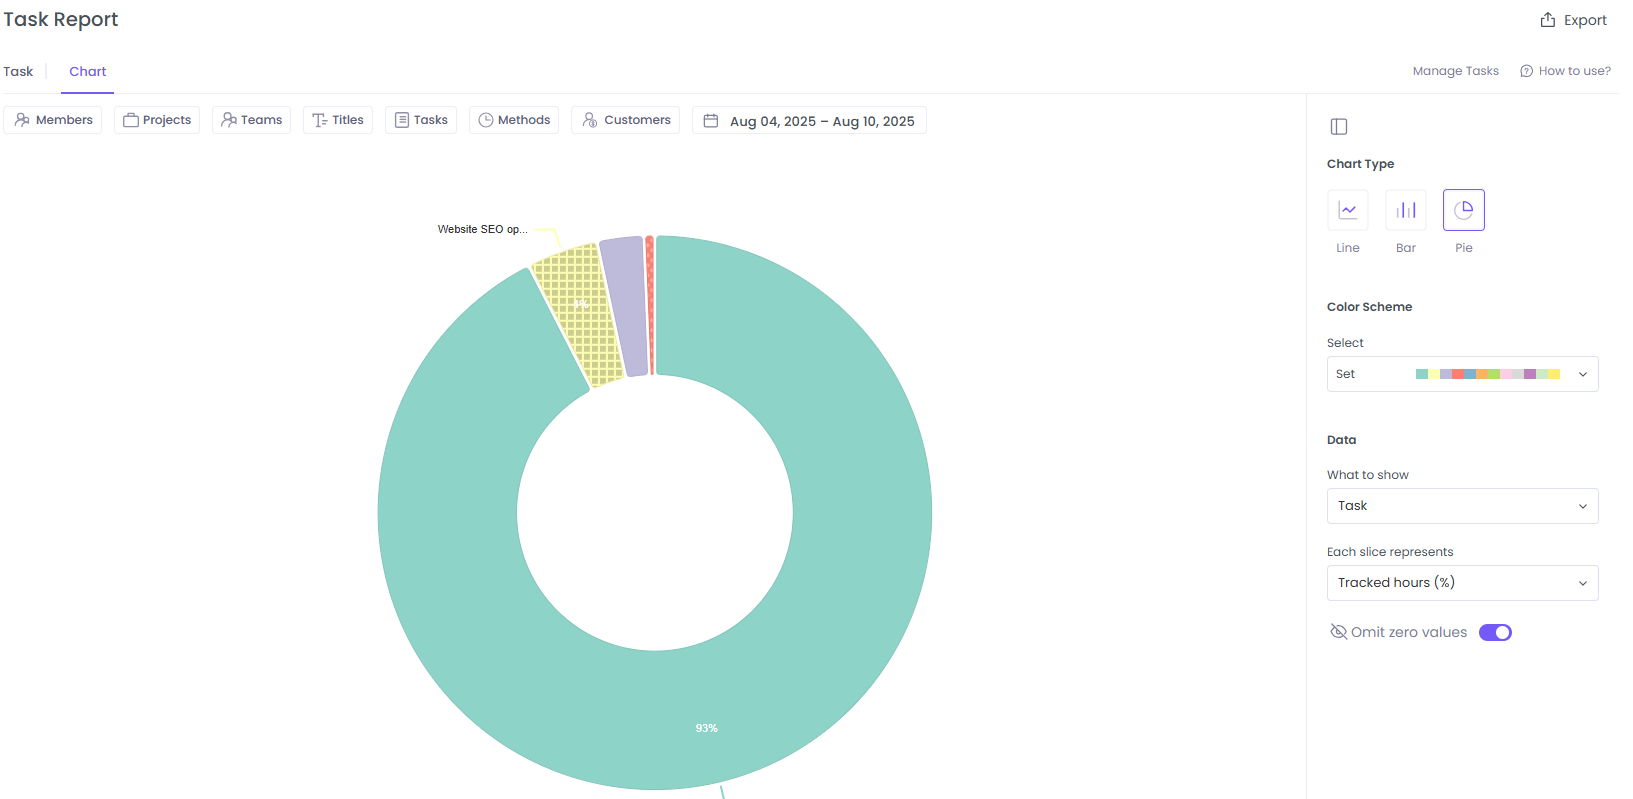
Charts
To get a visual idea on tasks and time spent on them, use the chart view. You can set the chart to be line, pie, or bar.
Filtering task data
The Task Report page offers several filtering options, including:
- Members
- Projects
- Teams
- Titles
- Tasks
- Methods
- Customers
- Date
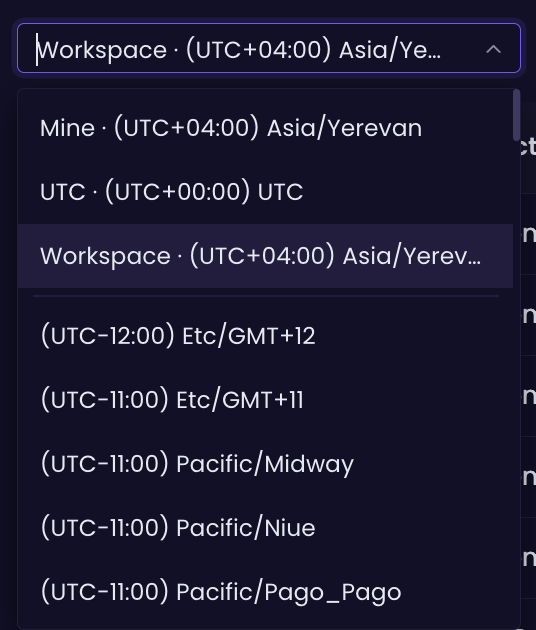
Timezones
A timezone selector is available on the Tasks report, for managers who review work across regions. The selector changes the timezone the report is displayed in, so the same data can be read in a client’s or a team member’s local time without exporting it or recalculating by hand, and the selection applies to every date and time shown in the report:
Was this article helpful?
Thanks for your feedback.