Viewing the Attendance report
To view the Attendance report in WebWork:
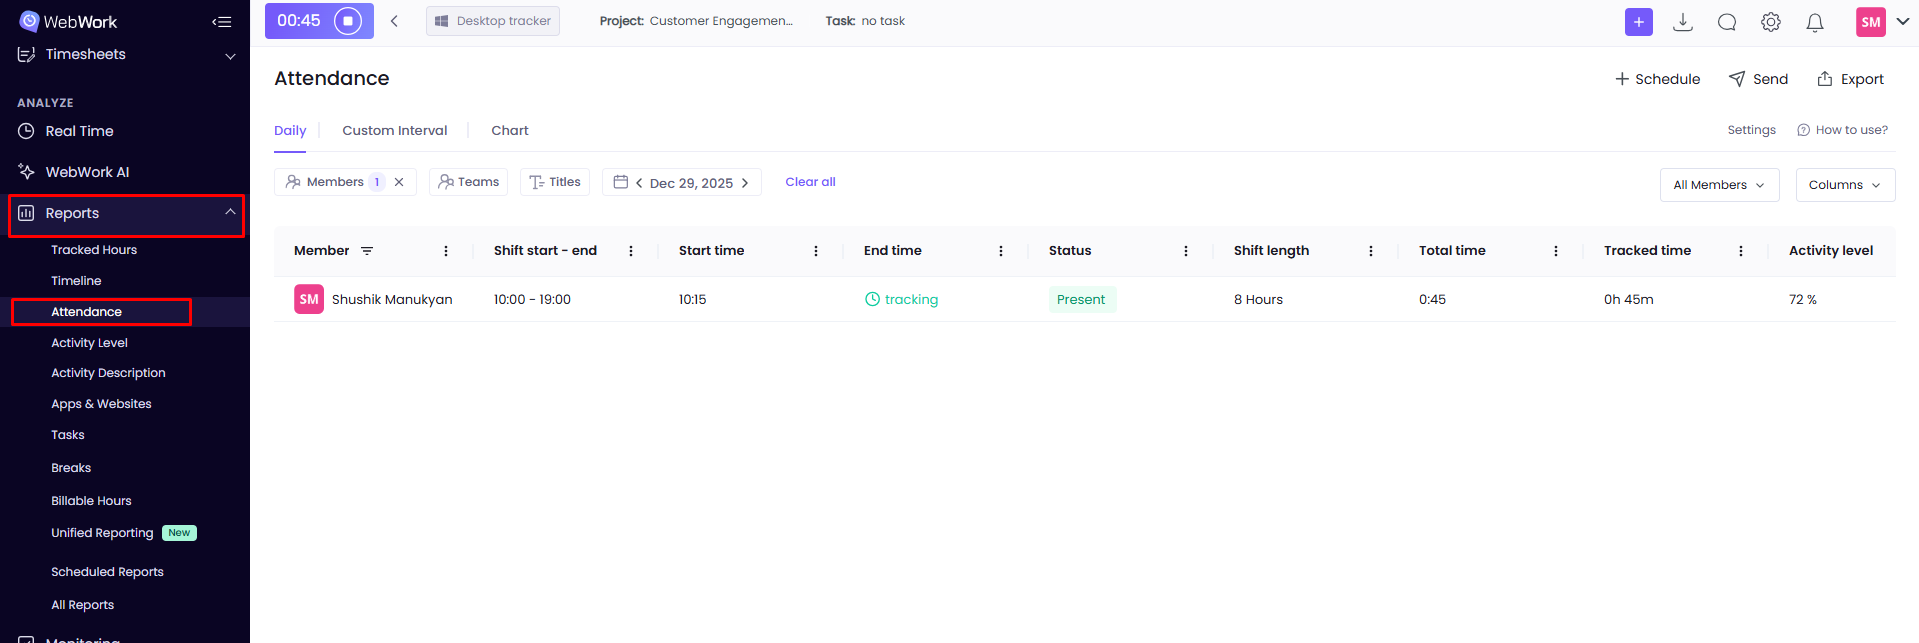
- In your dashboard, go to Reports > Attendance
On this page, you can see how much time your workspace members have tracked each day. By default, you can see detailed tracked time data for a specific day. This includes how much time was tracked, how much was added, activity levels, and more.
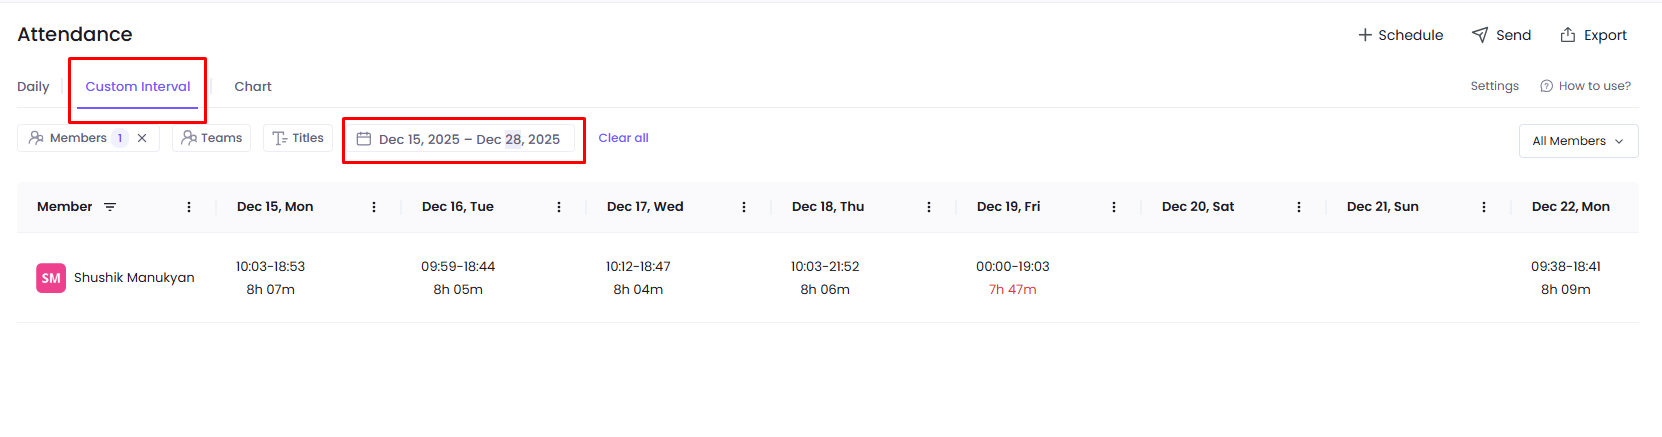
To view attendance data for multiple days at once, switch to the Custom Interval view by clicking the text in the top-left of the page. Here, you can see when workspace members started and stopped working, along with their total tracked time on multiple days.
Daily Extra Hours, Outside/Inside Working Hours
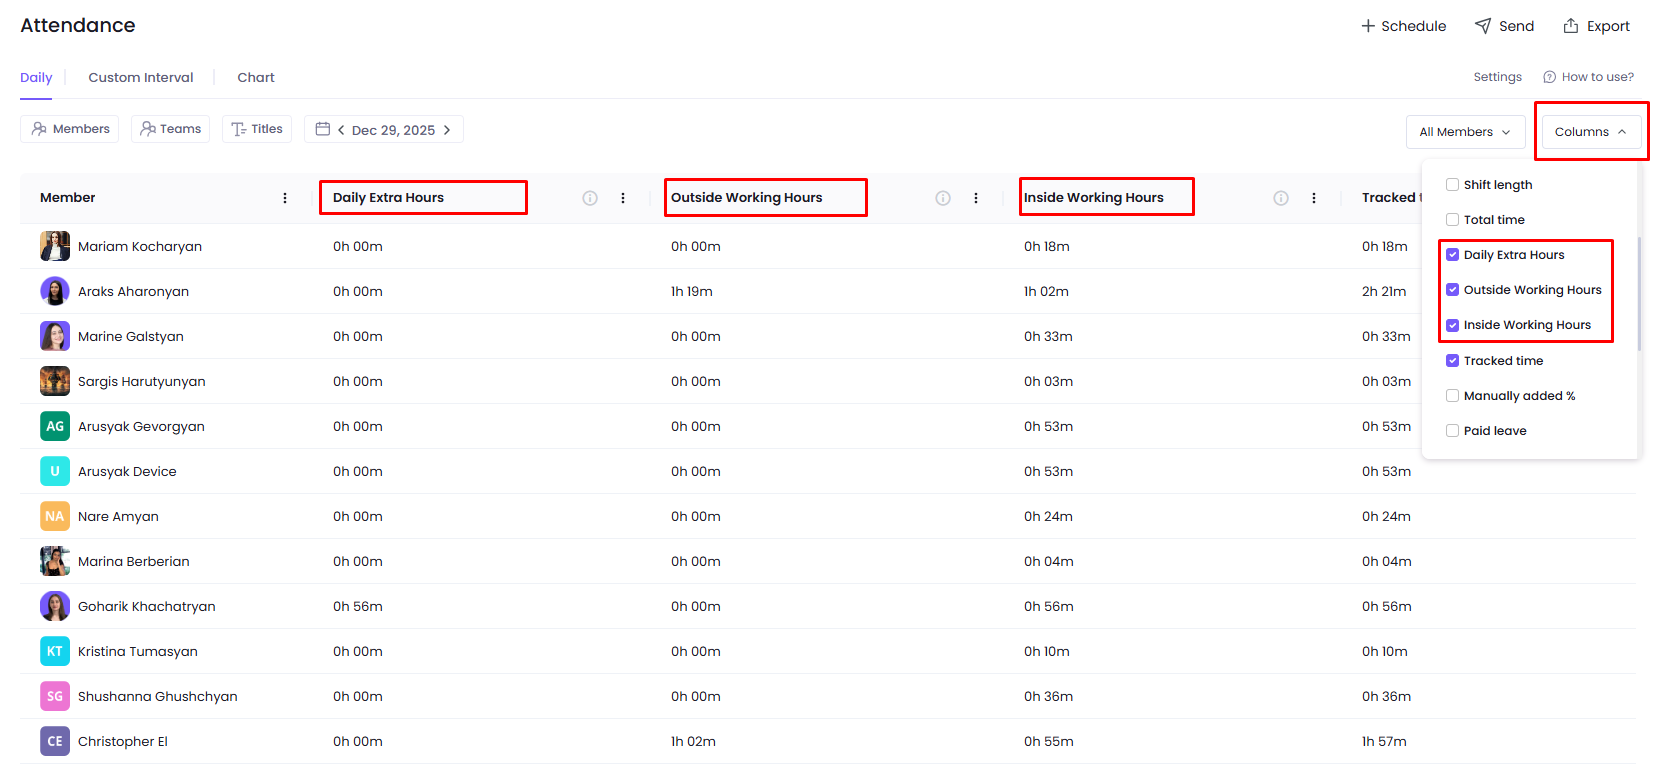
If you want to see how much time your employees spent working extra hours, what percentage of their work time is inside and outside of their shift, you can switch on these columns. Daily Extra Hours indicate the time worked beyond the expected daily hours. Outside Working Hours show the time worked outside the defined working hours and Inside Working Hours demonstrate the time tracked within the defined working hours.
Charts
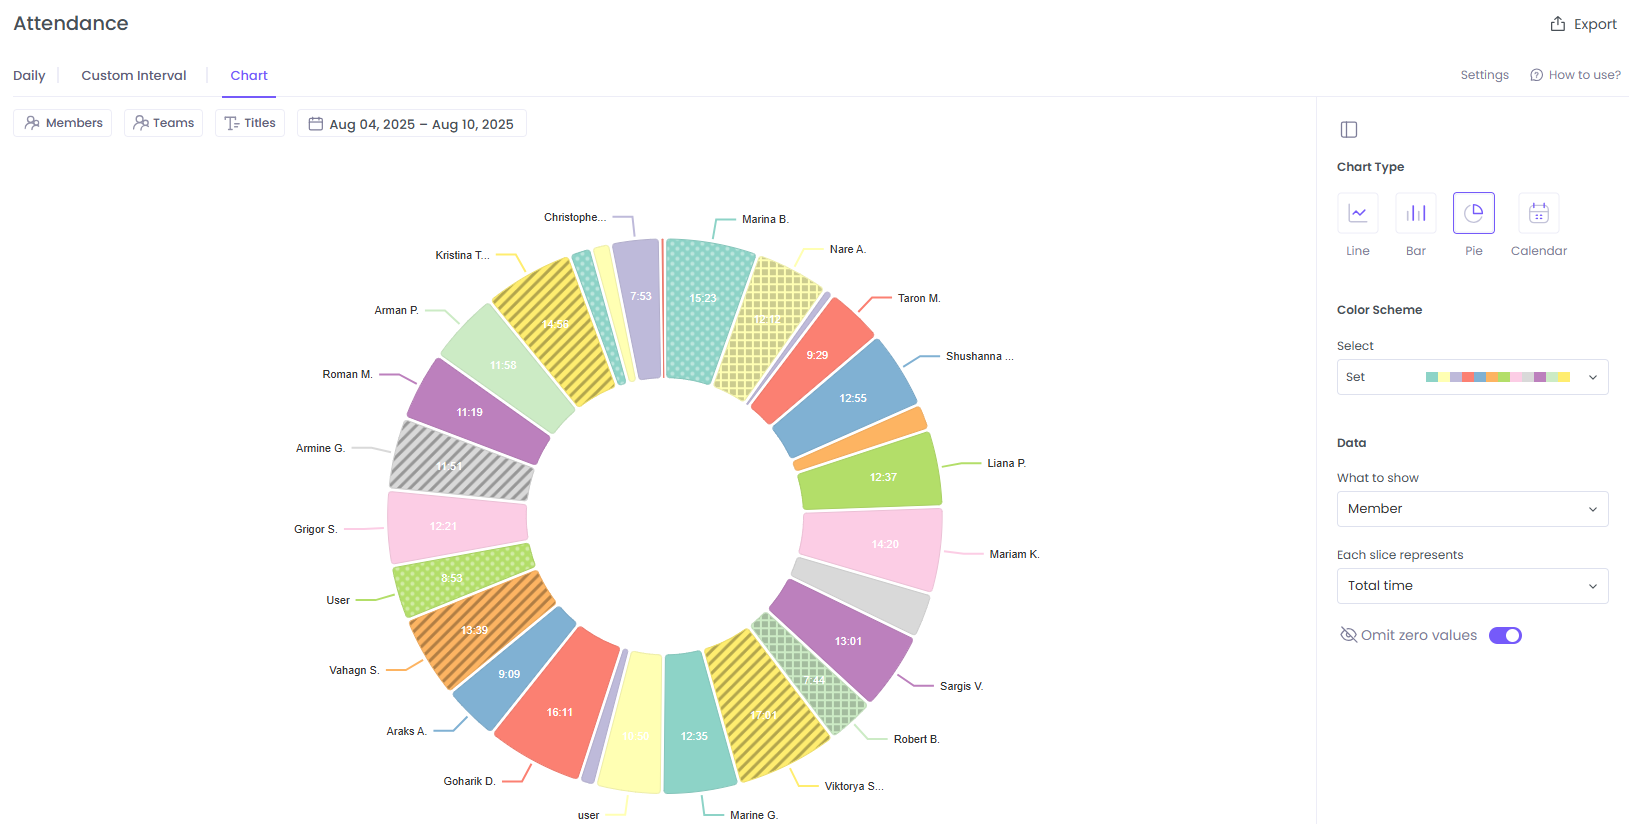
View the Attendance report in charts like line, bar, pie, or calendar.
Click the Chart tab and customize the chart from the right sidebar. Feel free to select the chart type and set the details for each (e.g. what data to show).
Filtering attendance data
The Attendance page offers several filtering options, including by member, team, and date. In the Daily view, you can set the date filter to a specific day. In the Custom Interval view, you can choose a period of multiple days. You can also view the attendance data of workspace members who started late, left early, tracked less time, or were absent. Simply click the All dropdown menu in the top-left and choose the option you wish to see.
Was this article helpful?
Thanks for your feedback.