Viewing timeline reports
To view timeline reports:
- In your dashboard sidebar, go to Reports > Timeline
On Timeline reports, you can see the tracked time of your workspace members in a timeline format.
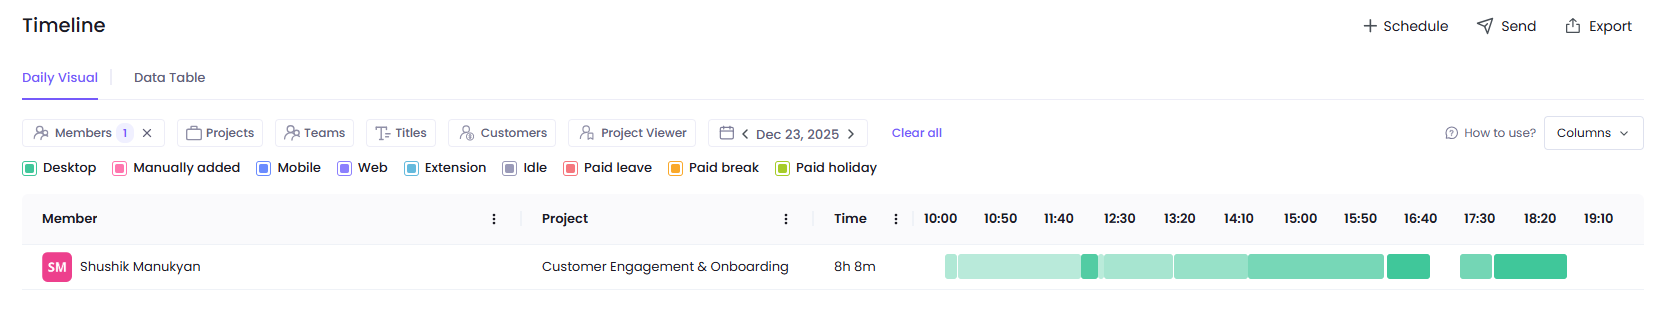
The Timeline page has two views: Contract and Member. The Contract view shows the tracked time data of your workspace members by their assigned projects. The Member view combines this data and displays it for each member.
Each color stands for a time tracker type that was used in that period
Time data is shown in several colors on this page. Each color corresponds to a time tracker that was used by the selected member. On top of the page, you can see which color stands for which tracker type.
Time tracked with the Desktop tracker will appear in different shades of green. The darker the green, the higher the activity level of that period and vice versa.
If you hover over each timeline block you will see more data, including mouse, scroll, and keyboard activity.
Filtering timeline data
The Timeline page offers several filtering options, including:
- Teams
- Member titles
- Date
These filters allow you to view the tracked time data of specific workspace members. You can also view tracked time data on a specific day by setting the Date filter.
Editing timeline data
To edit timeline data, click Edit timeline intervals in the top-right of the Timeline page. Learn more about editing time data in the Time Editor help page.
Data Table View
To be able to see the reports in a table format, you should click on Data Table next to Daily Visual.
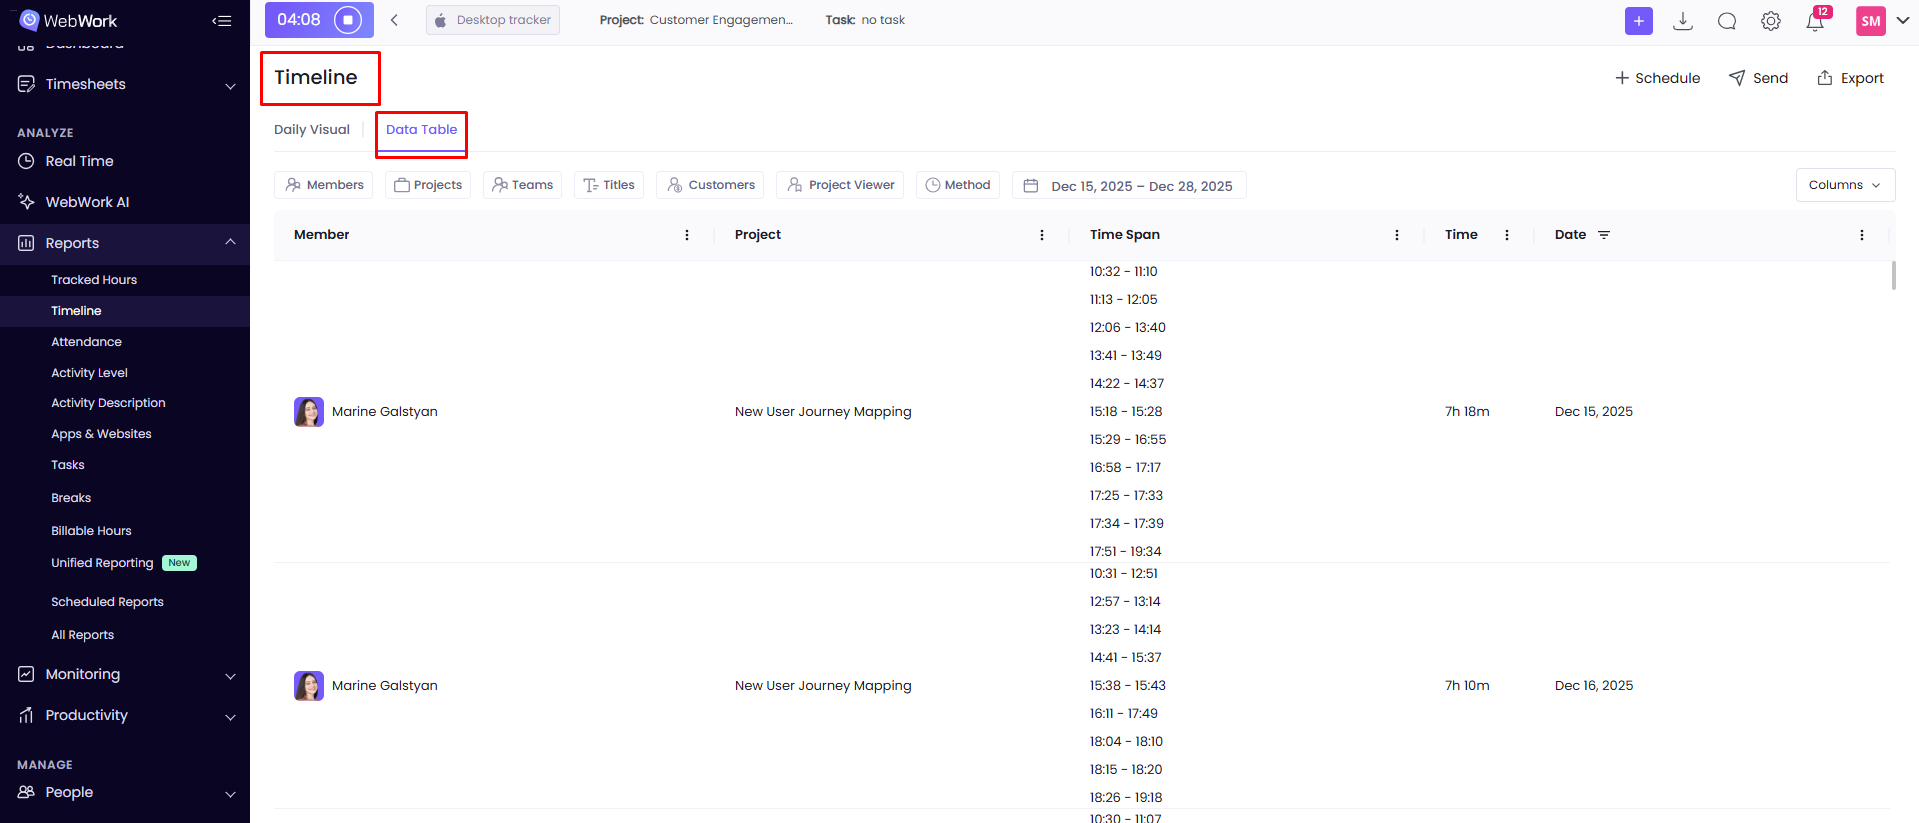
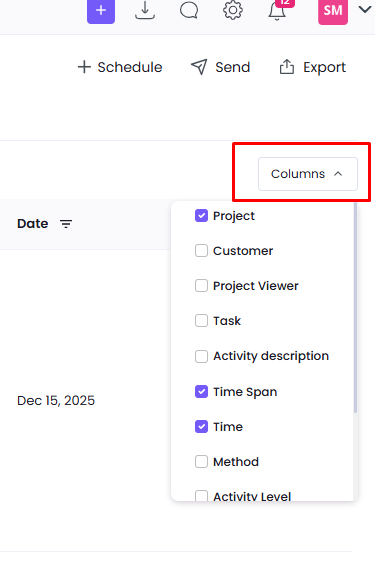
Here you can see the time span the member was working on a specific project or tasks, as well as the short pauses and inactive times that were taken during the working period. You can apply filters or customize the columns depending on which columns you would like to see.
Was this article helpful?
Thanks for your feedback.