The Breaks report shows you the number and duration of breaks taken by workspace members.
To view the report,
- Go to Reports > Break
Columns in the Breaks Report
You will see the list of breaks taken by each member, along with the Break Policy, duration, whether it is paid or unpaid, and the amount if it is paid.
Select which columns of data to see by clicking Columns in the upper right-hand corner and selecting the ones you want to be shown in the report.
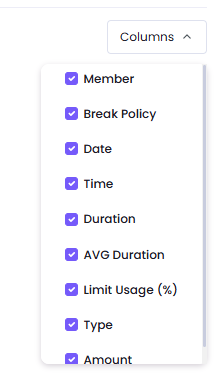
By enabling AVG Duration column you will be able to see the average break duration for that specific day. If you took more than one break throughout the day then it will calculate the average duration of all the breaks of that day. However, if you took only one break, then the average duration will be equal to the duration of the break.
Limit Usage indicates the percentage of the break that was used, based on the break policy and its maximum allowed minutes per day.
Breaks Report Chart
To view the report in a chart, click the Chart tab.
Customize Your Chart
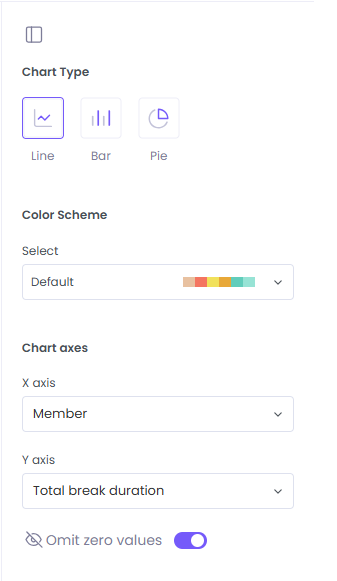
On the right side of the chart, you’ll find customization options:
-
Chart Type
-
Line Chart
-
Bar Chart
-
Pie Chart
-
-
Color Scheme
Select your preferred color palette for the chart. -
Chart Values
Customize the chart by editing:-
X-axis values
-
Y-axis values
-
You can also toggle Omit Zero Values, which excludes time entries without breaks.
Exporting the Chart
To export the chart, click Export to download it as a PDF file.
Was this article helpful?
Thanks for your feedback.