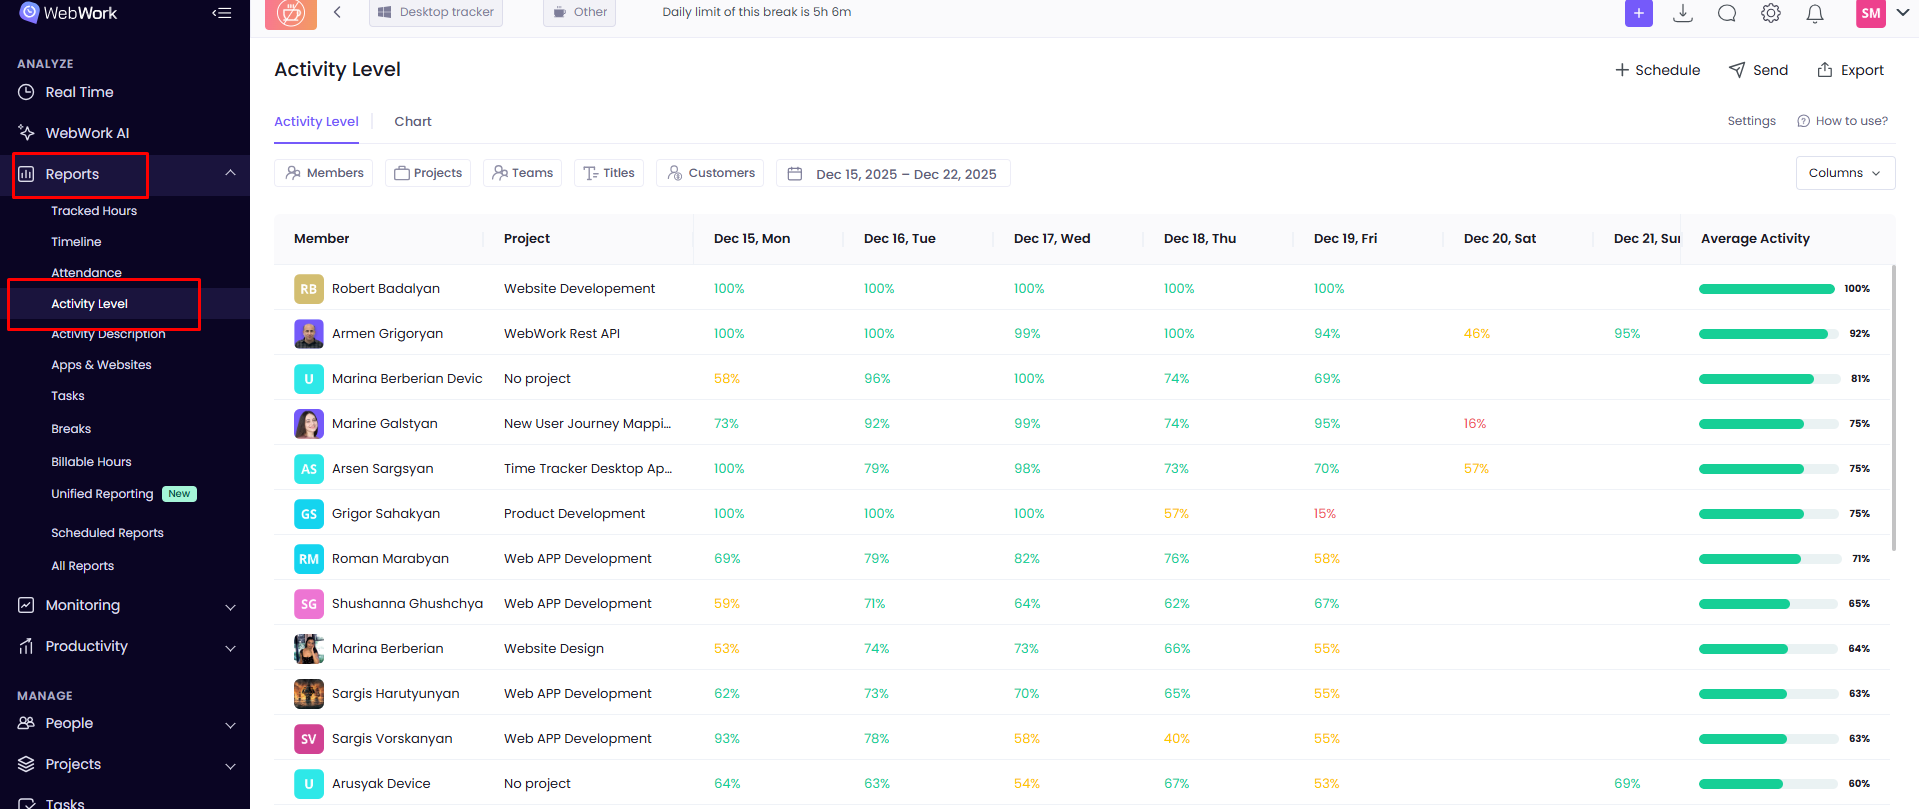
Viewing activity level reports
To view activity level reports:
- In your dashboard, go to Reports > Activity Level
Here you can view the daily average activity level of your workspace members. By default, the Activity Level page will filter and show data from the current week. You can also filter the report by Project and Member.
How is activity level calculated?
WebWork uses a custom formula to calculate the activity level of your workspace members. It uses the keyboard, mouse, and scroll wheel activity of members for this.
To learn how activity level is calculated, view the How does WebWork calculate activity levels? page.
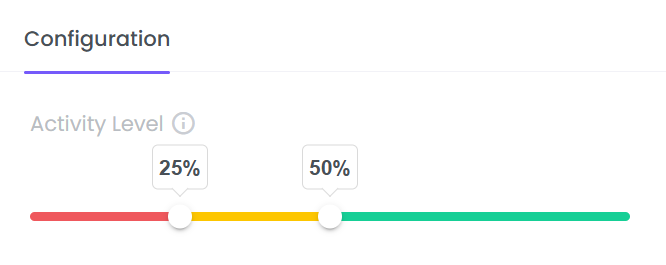
How to define activity-level ranges?
To define the ranges of activity levels for the tracker to use,
- Go to Settings > Activity
- Set the slider values to define the three ranges
Based on this setting, the tracker will display ctivity reports in three colors— red for low activity level, yellow for medium, and green for high activity level.
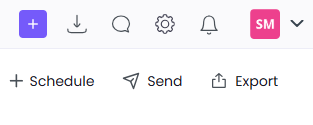
Sending, scheduling, and exporting reports
WebWork allows you to send, schedule, and export your activity level reports.
By clicking on the button Send, a pop-up will appear on your page with two windows. On the first one you will see written By email. By filling in the necessary information, such as the email address, the subject of the email and message text, as well as selecting the convenient file type for export (CSV or XLSX), you will be able to send the report immediately to the person’s email.
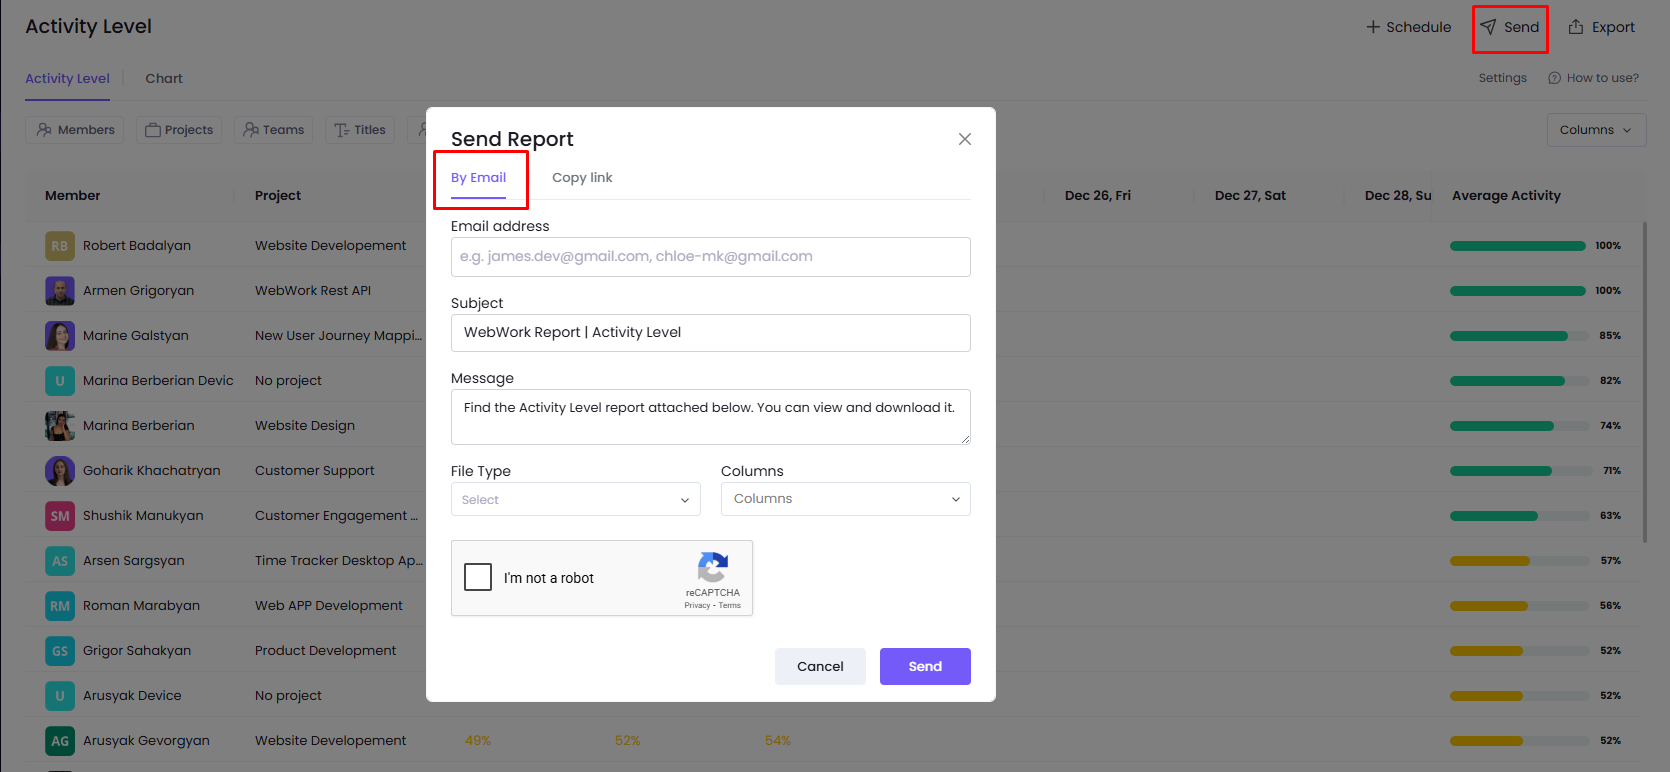
In the next section you will see the Copy Link text. In this case you can simply share the link which will available even for people who do not have a WebWork account.
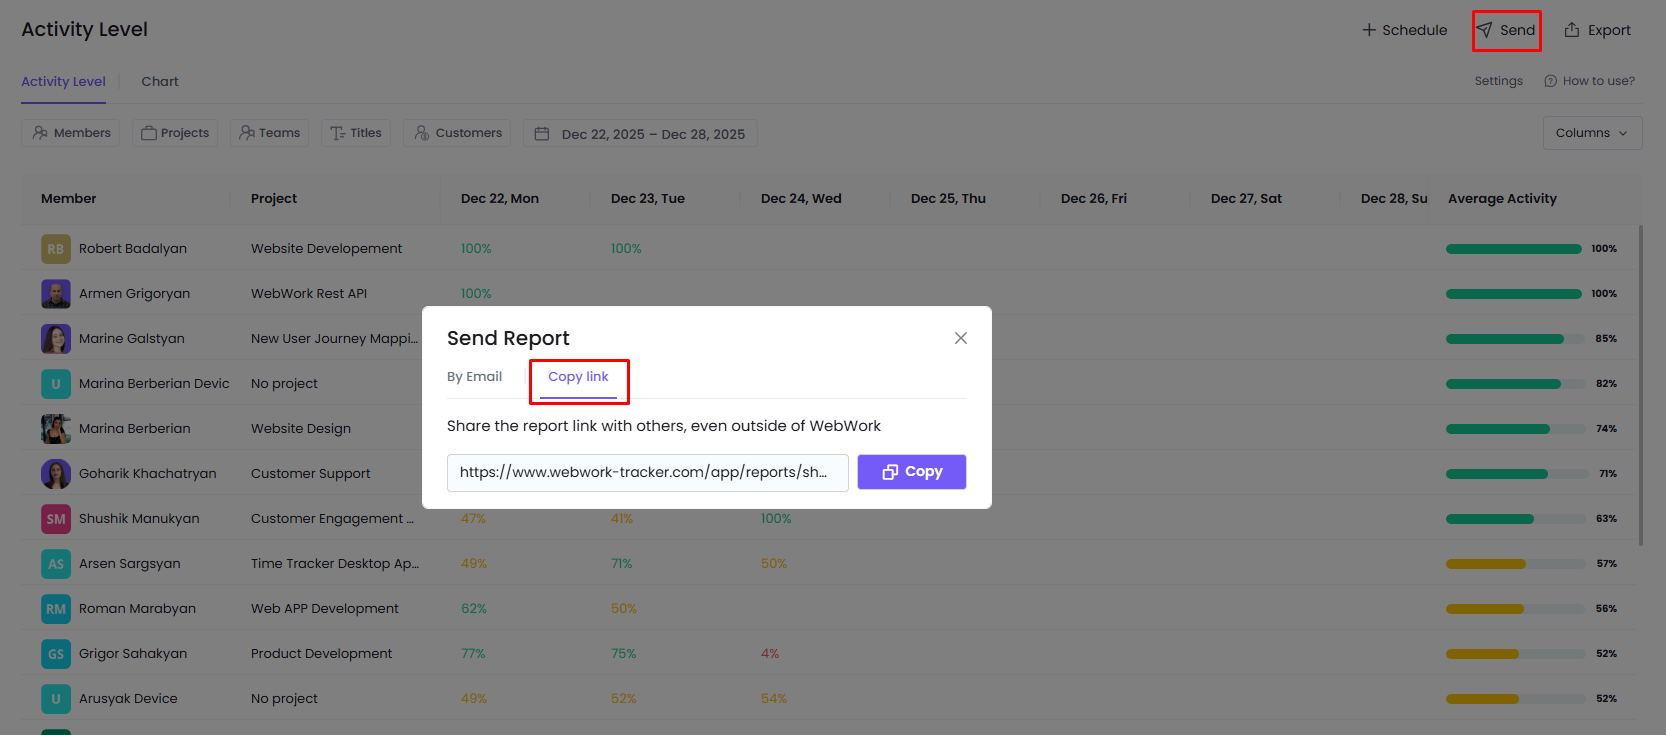
Note, that the Schedule and Send options are available to you of you are a Plus or a Premium member.
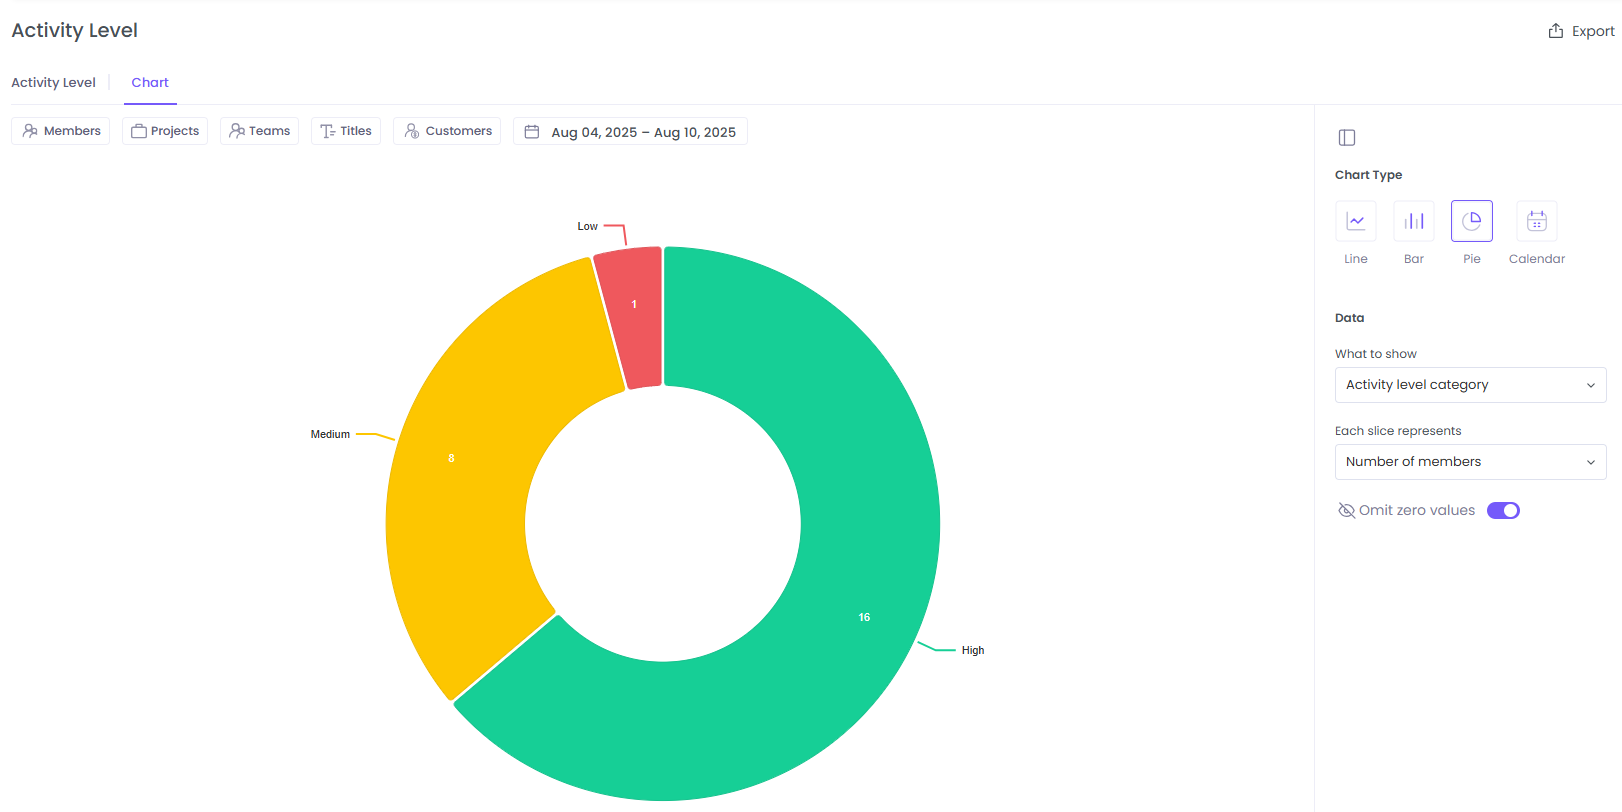
Charts
Use the Chart tab to view the Activity Level report in charts. Feel free to customize the chart by selecting the type to be line, bar, pie, or calendar and set their details like what data to show.
Was this article helpful?
Thanks for your feedback.