To view productivity data in your workspace:
- In your dashboard sidebar, go to Productivity > Productivity Insights
On Productivity page, you can see:
- Detailed tracked time
- Workspace average active and inactive time
- Tasks overview
- Attendance overview
- Productivity labels of used platforms
- Categories of apps & websites members spent time on
- Productivity percentages
- App & websites usage
- Activity level overview
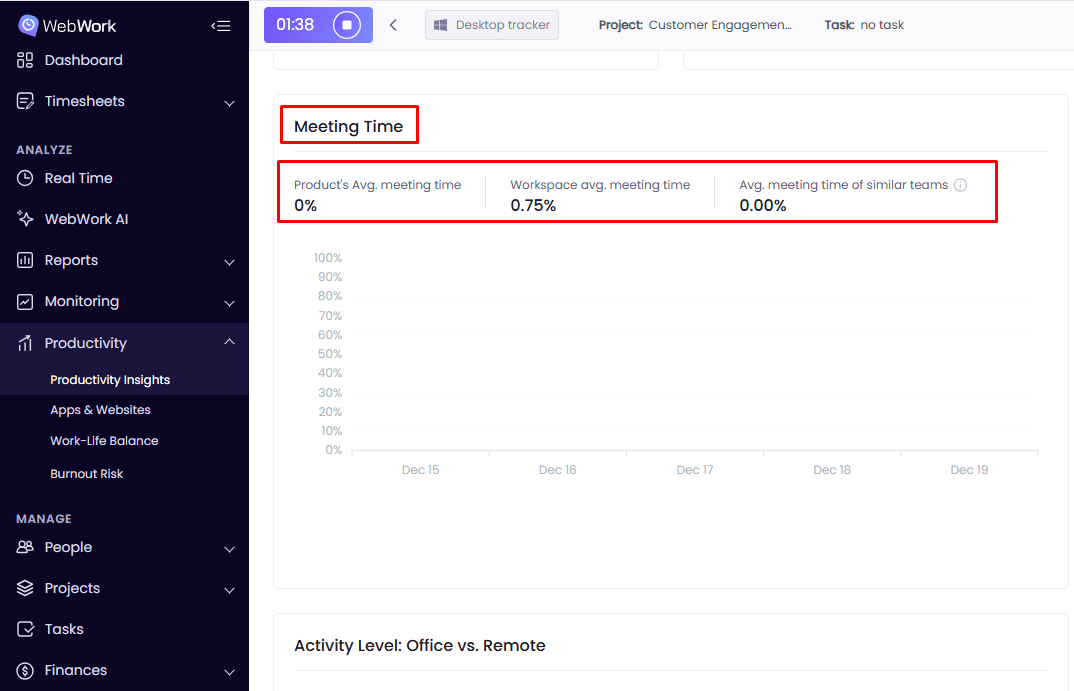
- Meetings & calls
- Activity Level: Office vs. Remote
Note: to set productivity labels for apps and websites, go to Productivity > Apps & Websites.
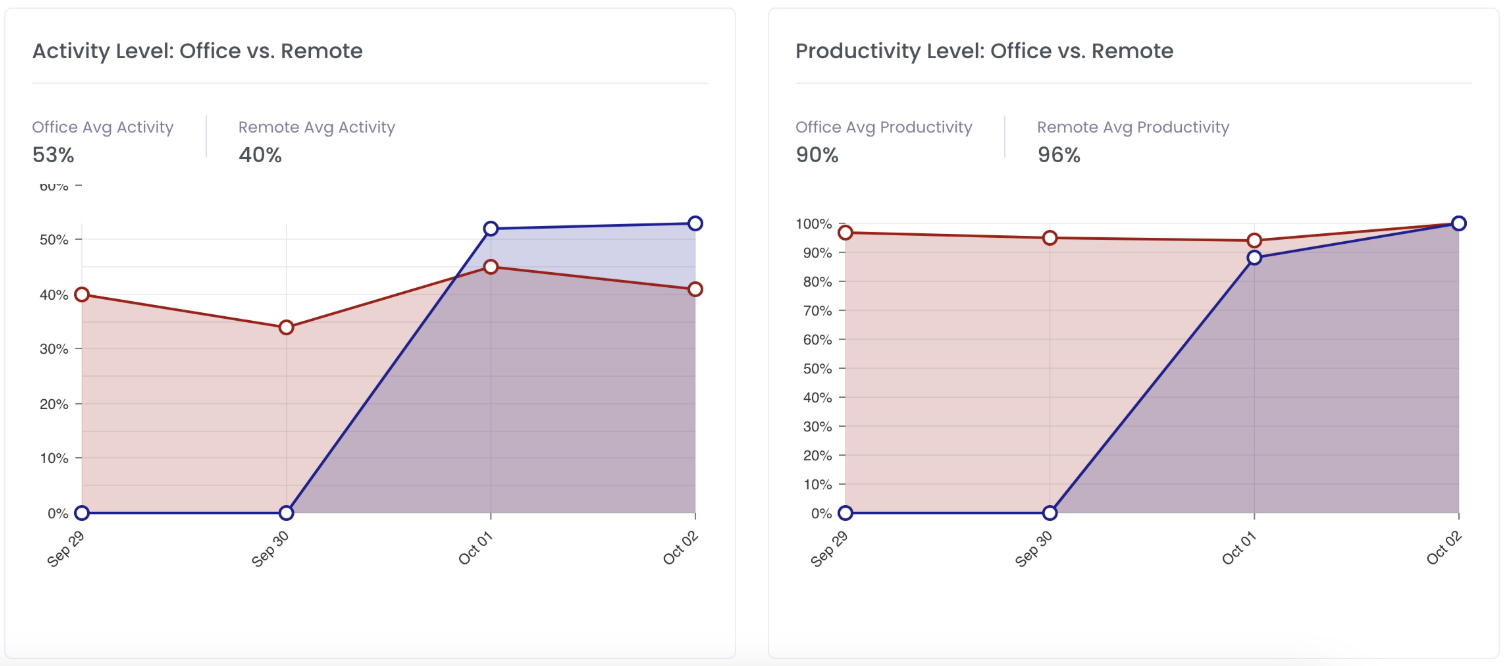
Activity Level: Office vs. Remote
In the Activity Level: Office vs Remote section, you can easily compare activity and productivity levels between your office and remote teams through clear, visual graphs.
With these insights, you can:
-
Compare activity levels between members working remotely and those in the office.
-
Identify productivity trends based on location (e.g., higher activity during remote workdays).
-
Make informed decisions about hybrid or remote work policies by relying on real data rather than assumptions.
-
Spot discrepancies in engagement that may indicate areas for improvement or additional support.
This section provides easy-to-read visual graphs, allowing you to interpret data at a glance. Whether you manage a fully remote team, an in-office team, or a hybrid model, this view gives you clear visibility into how location impacts performance.
You can view productivity data in three ways:
- Per Member
- Per Team
- For Workspace
Per Member and Per Team views
By default, the Productivity page will be in the Per Member view. This view displays data with visual graphs and charts.
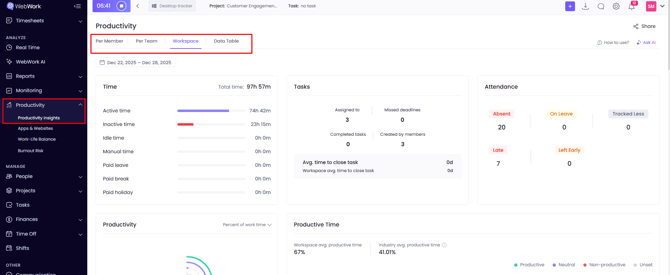
Workspace view
The Workspace view shows detailed productivity data for your entire workspace:
- Activity levels
- Tasks
- App and website usage
and much more. You can export productivity data from All Members view in CSV and XLS.
Note: the Workspace view is only available to Executive Managers and the Workspace Owner.
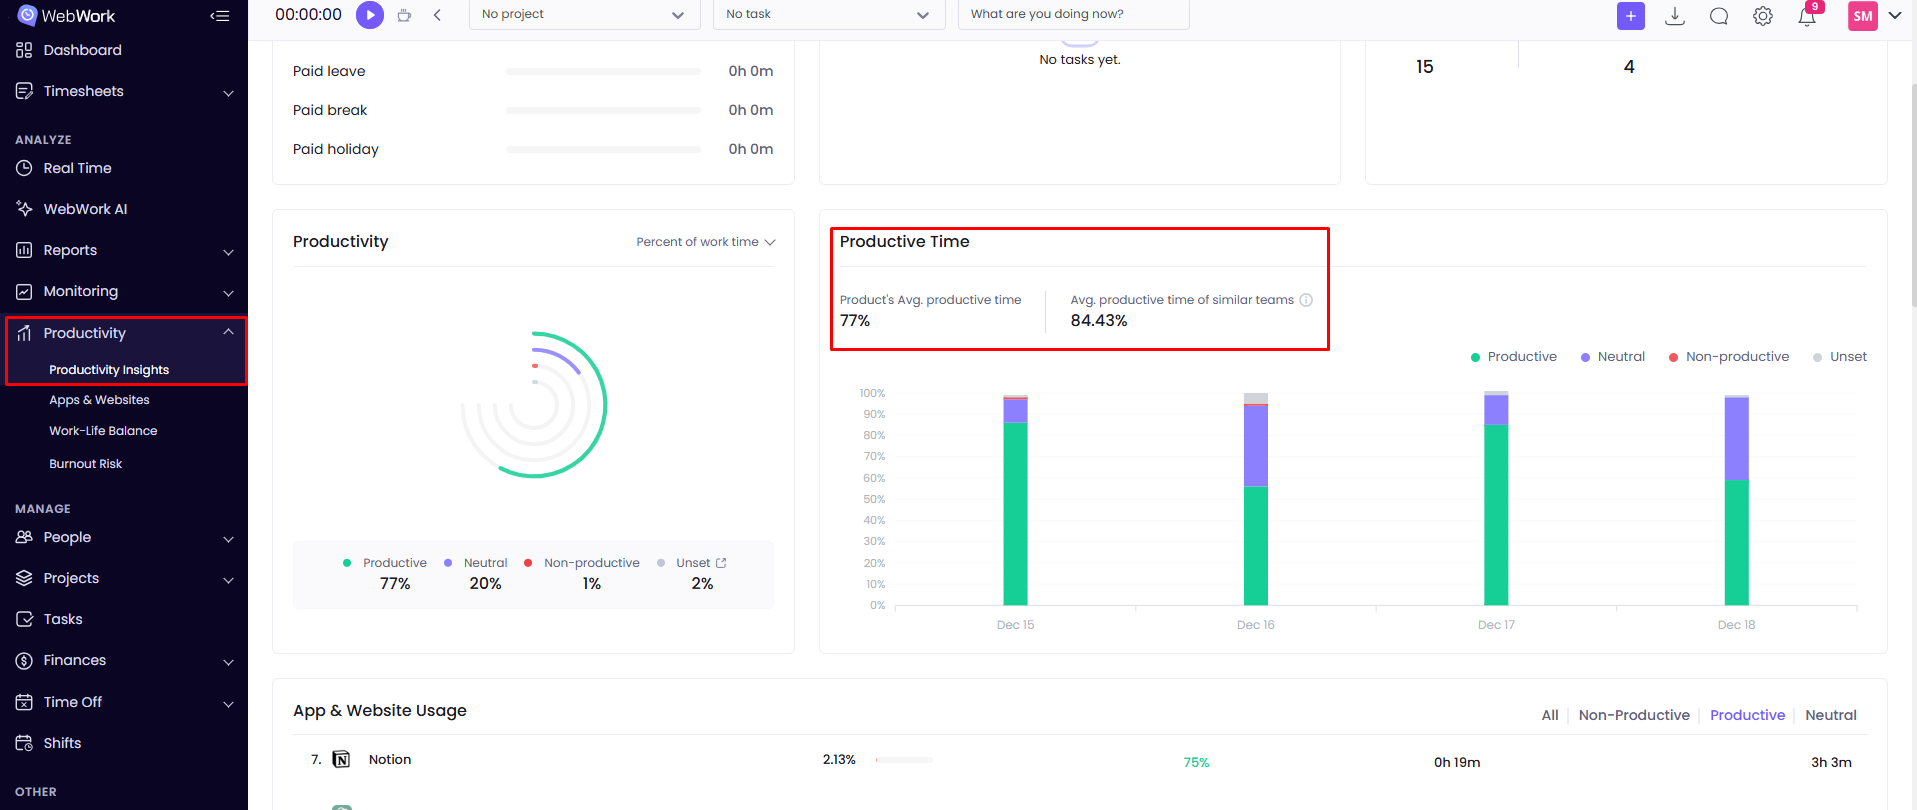
If you are a Plus or a Premium plan user, then you will have access to our Benchmarks feature.
Benchmarks help to boost productivity by comparing benchmarks of different metrics of the industry peers with all the WebWork users and offering insights into how others perform in the same areas. You can explore more about this feature in Productivity Insights subsection.
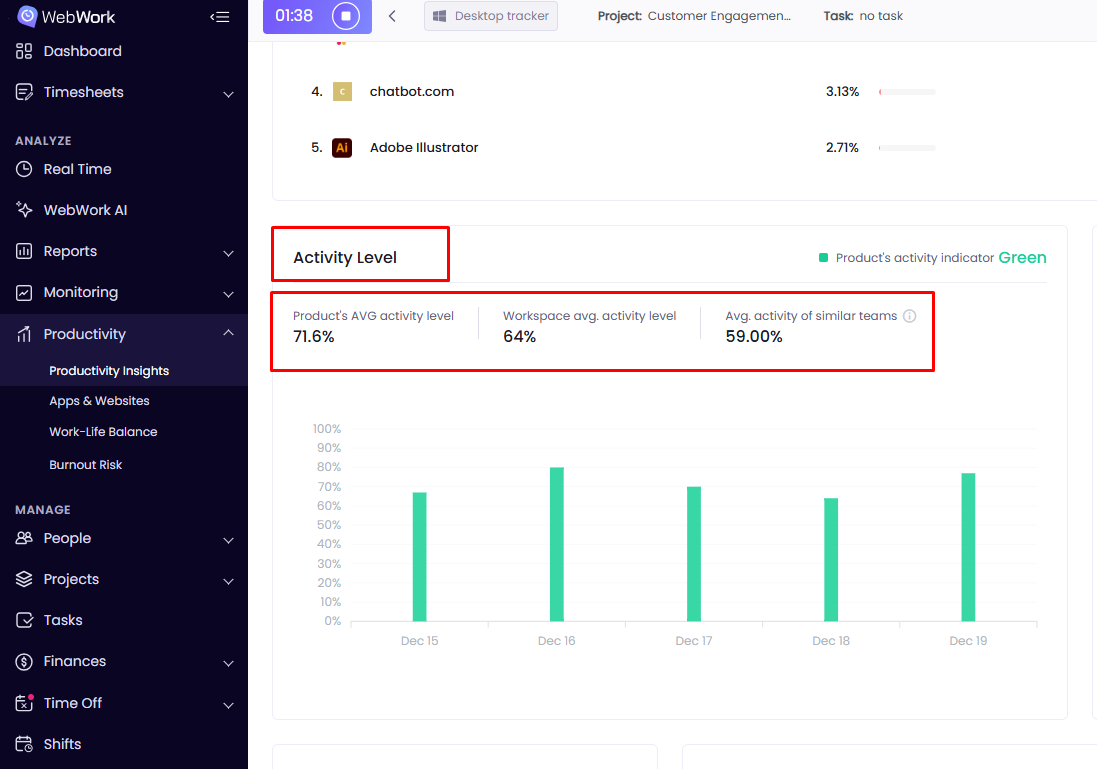
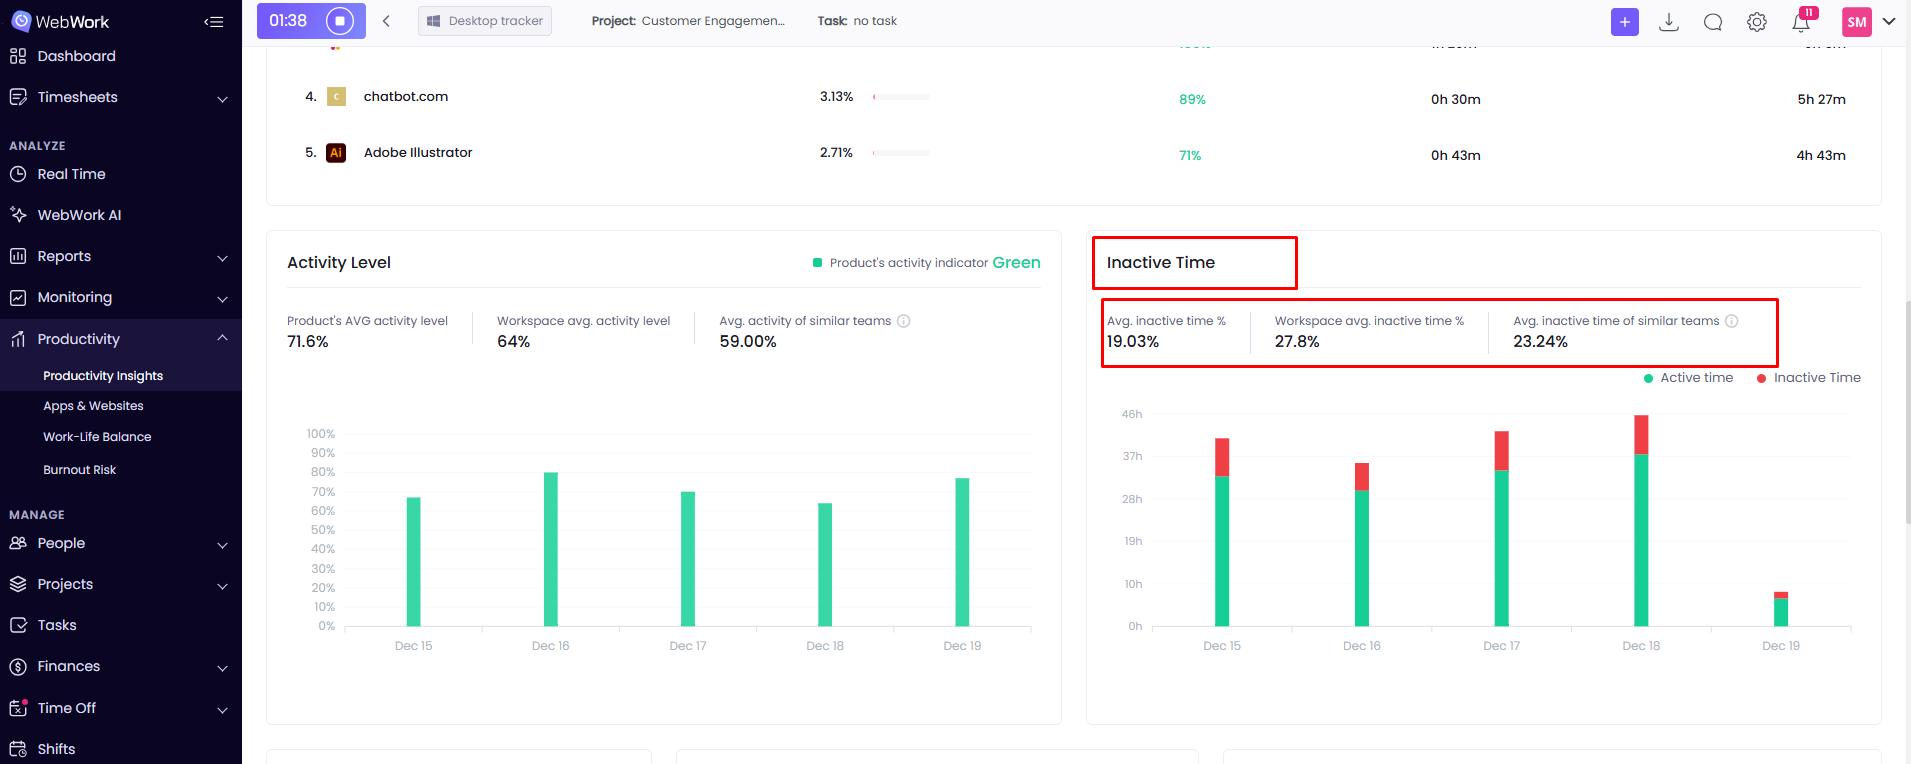
Here you can see different filters to have a better understanding of the particular member’s, team’s or the whole workspace’s productivity. The benchmarks will appear in the widgets showing:
- The productive time
2. Activity level
3. Inactive time
4. Focus Time (time spent actively working without distractions)
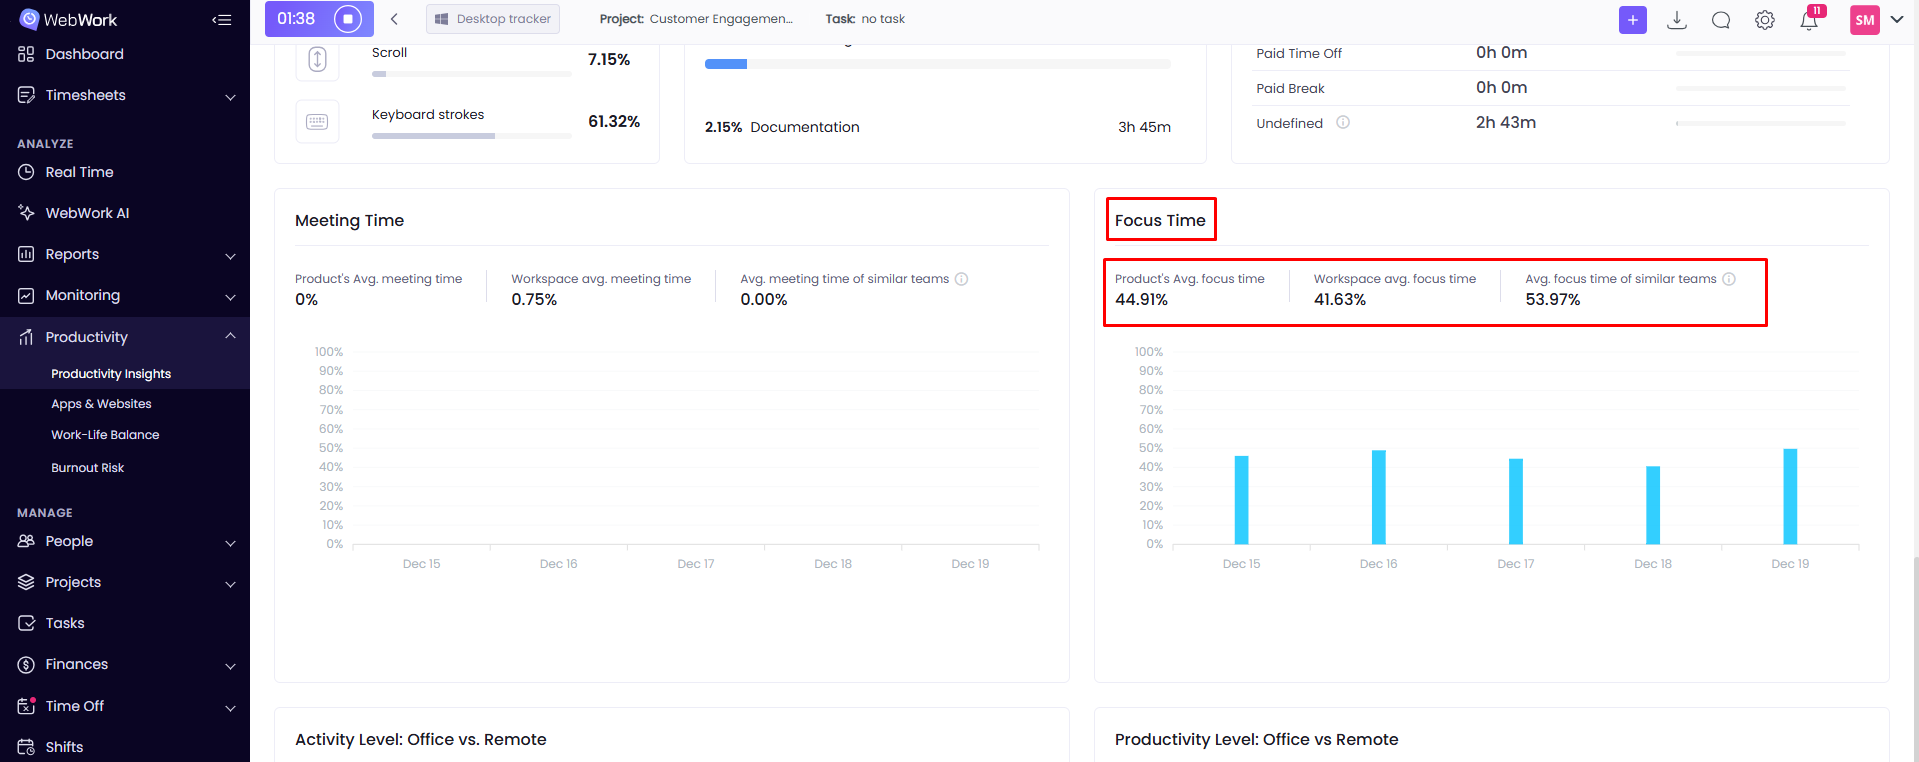
5․ Meeting Time
If your filter is by Member, then in the widgets above the first thing shown will be the selected member’s productivity or activity; after that, WebWork will find and match WebWork users across the whole platform with the same or similar titles (e.g., Customer Success Manager/Content Writer), and display a comparison of their productivity, activity level and inactive time. However, if the system cannot find similar titles, then the comparison will happen against all the platform users.
If your filter is by Team, WebWork will find and match other teams with the same or similar mission, name or responsibilities and compare the results of the same sections (productivity, activity level and inactive time). Likewise, if the filter is by Workspace, then your workspace will be compared to other workspaces within the same or similar industry.
You can also view the information about your team’s or workspace’s productivity using Data Table view.
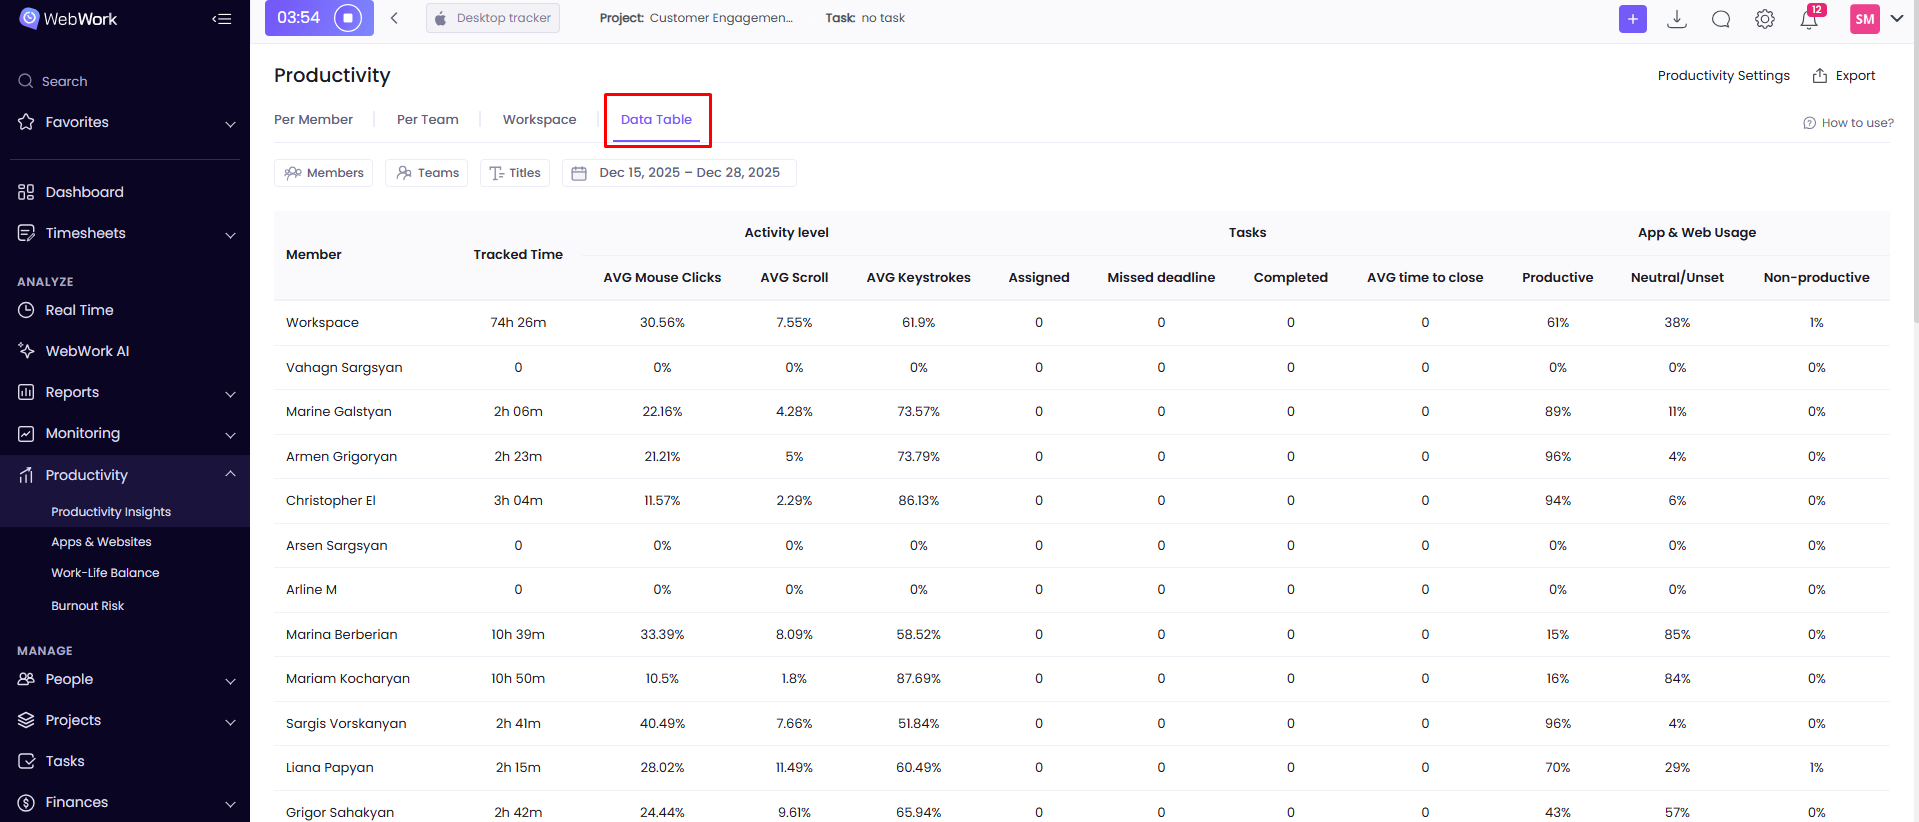
This is more convenient for exporting the sheet as a report. Here you can see every member of your workspace with the information about their Tracked Time, Activity Level, Tasks, as well as their Apps and Website Usage. The first line displays the same metrics of the whole workspace.
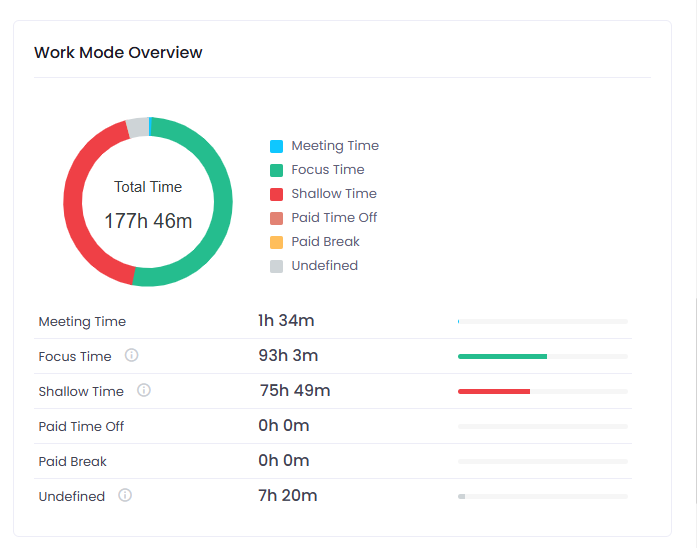
Work-Mode Overview
In Productive Insights you will also be able to see a section named Work Mode Overview if you are a Plus or a Premium user. Here you can see the focus time, shallow time, meeting time, paid time offs and breaks as well as undefined times, which do not fit into any of these time categories, mostly manually added time. Focus time indicates the time with high activity, this is the time spent actively working without distractions. Shallow time, in contrast, combines the time spent working at a lower activity level.
Was this article helpful?
Thanks for your feedback.