Once you have signed up and set up your workspace, you can get to know your dashboard.
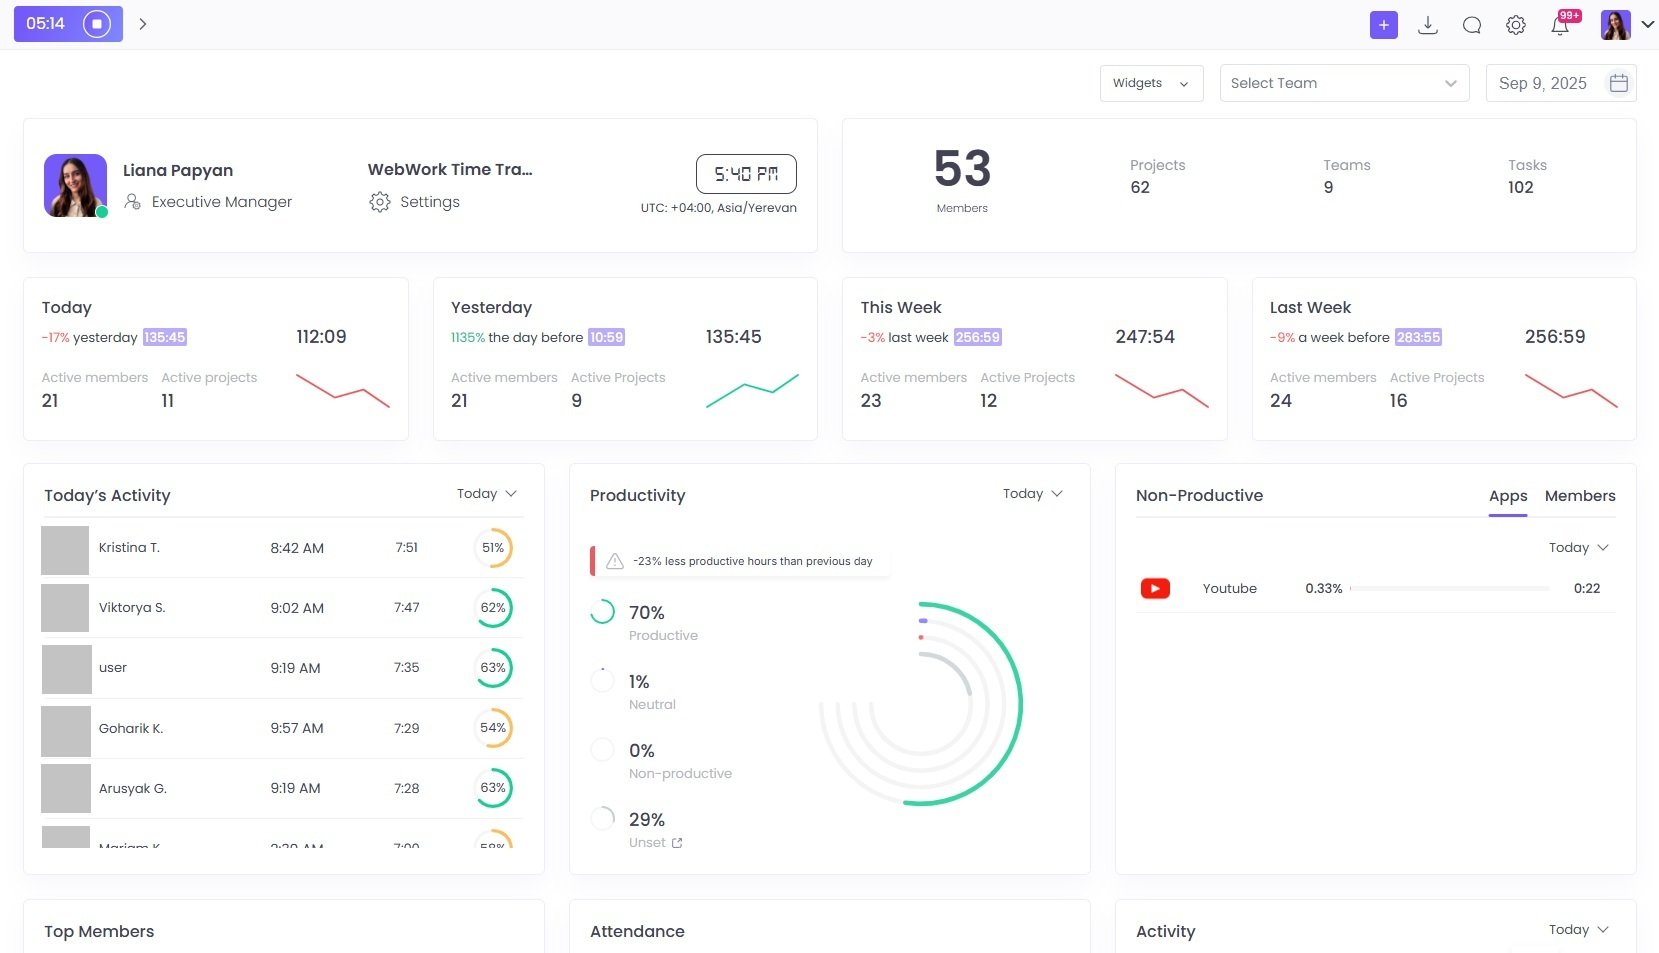
The dashboard shows you all the details about your team’s performance over the course of different time ranges:
- Today
- Yesterday
- This week
- Last week
You see today’s activity of each member in tracked hours and activity level, along with overall productivity levels.
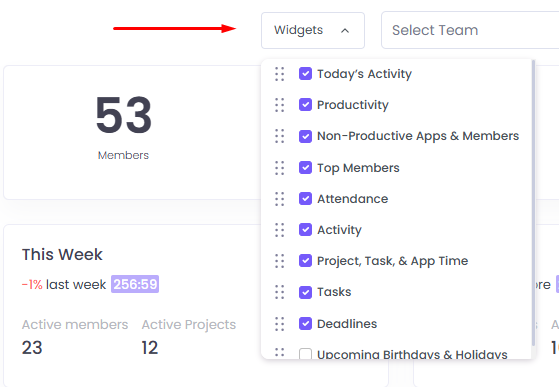
You can customize the dashboard by selecting which sections to see in Widgets.
In the non-productive section under Apps, you can see the top non-productive apps used by workspace members. Similarly, under Members you will see the top non-productive members.
If you scroll down, you will see sections for
- Top members
- Attendance
- Activity
- Tracked time on projects, tasks, and apps
- Tasks with statuses
- Missed and approaching deadlines
- Screenshots of members
The bottom sections show the following:
- Review section where you can submit your suggestions or requests
- Integrations section where you can connect WebWork with your favorite apps
- Download section to get the Desktop and Mobile apps
- Support section where you can reach out with any issues
Attendance dashboard
Additionally, you can view a separate Attendance dashboard:
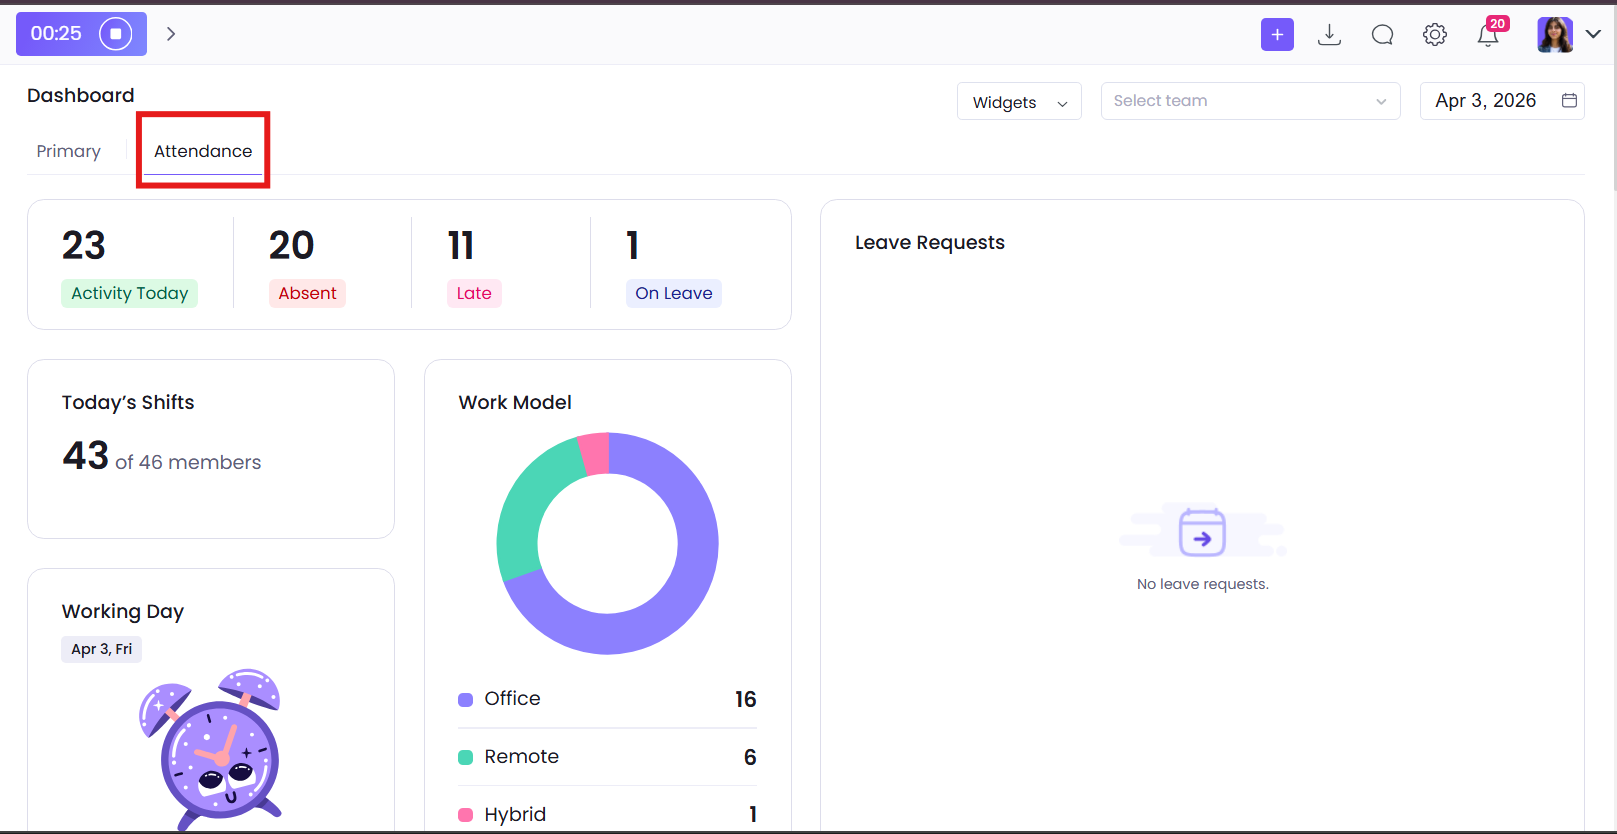
This dashboard gives you an overview about your team’s attendance, tardiness, work location, etc. By default, the dashboard starts with the information about how many people were late on that day, how many absent, on leave and active members you have for the date you have selected. Other information can be displayed, such as:
- Work model (from office, remote or hybrid)
- Leave requests for the day and people who are on leave already
- Weekly attendance (how many were absent/late/present on each day of the previous week)
- Upcoming holidays and birthdays
- Member trends (who left early/tracked less, who has the most absence rate, who was late on that day)
- Team trends (tardiness and absence rate evaluations for teams)
- Punctuality table (lists the most punctual people in the workspace)
- Work Anniversary (displays upcoming or current work anniversaries for employees based on their hire date (e.g., 1-year, 2-year milestones).)
Note, that you can also customize the widgets you want to see by clicking here:
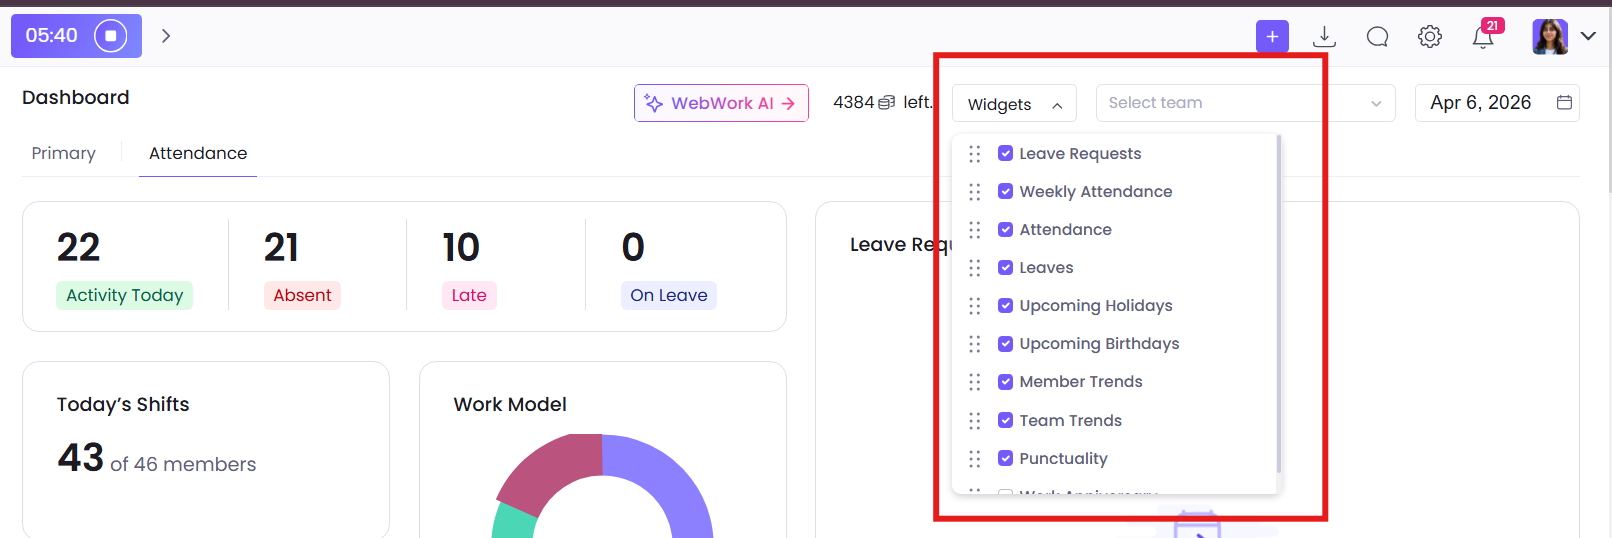
By removing the checkmark, you will no longer see that one specific widget. Additionally, you can also change the arrangement of those by pulling them down or lifting them up.
Finance Dashboard
A separate dashboard for finance is also available. This dashboard is available for the Plus and higher plans. Users will see paid and pending invoices for both team members and customers, salary and payroll summaries, expense tracking, project budget status, payment breakdowns through interactive charts and more. This dashboard allows managers to have a full financial picture without the need to jump between multiple reports. The dashboard also includes the possibility to customize the widgets you want to see. Again, by removing the checkmark, you will no longer see that one specific widget and by pulling them down or lifting them up you can also change the arrangement of those:
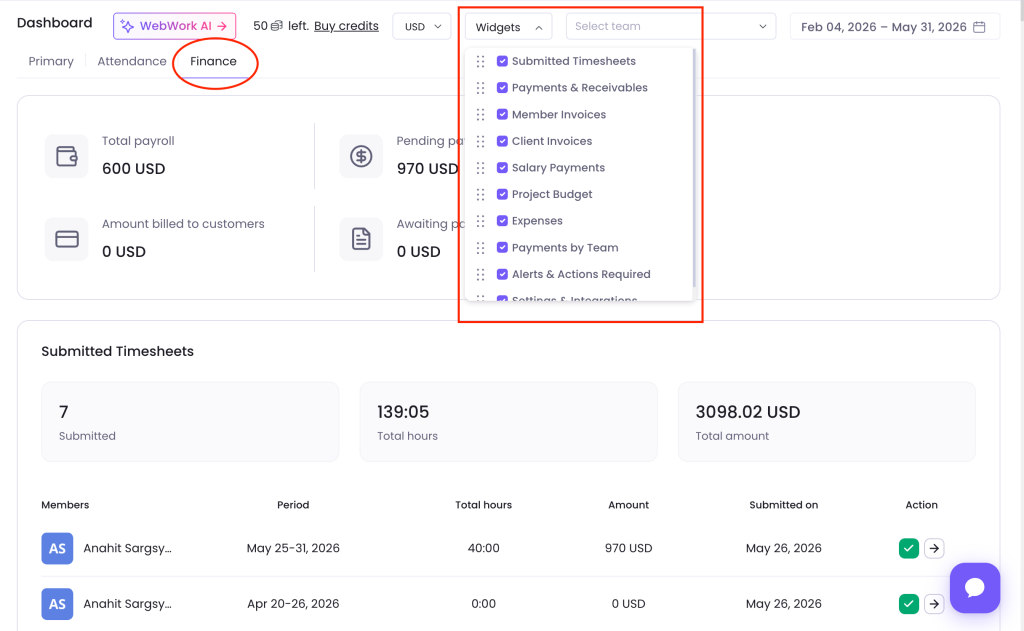
The following widgets are available in the Finance Dashboard:
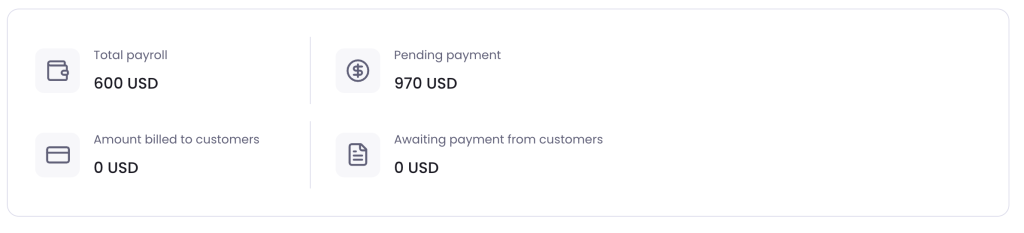
- Summary of the total payroll, pending payments, amount billed to customers, or awaiting payments from customers:
- All the submitted timesheet for the selected period.
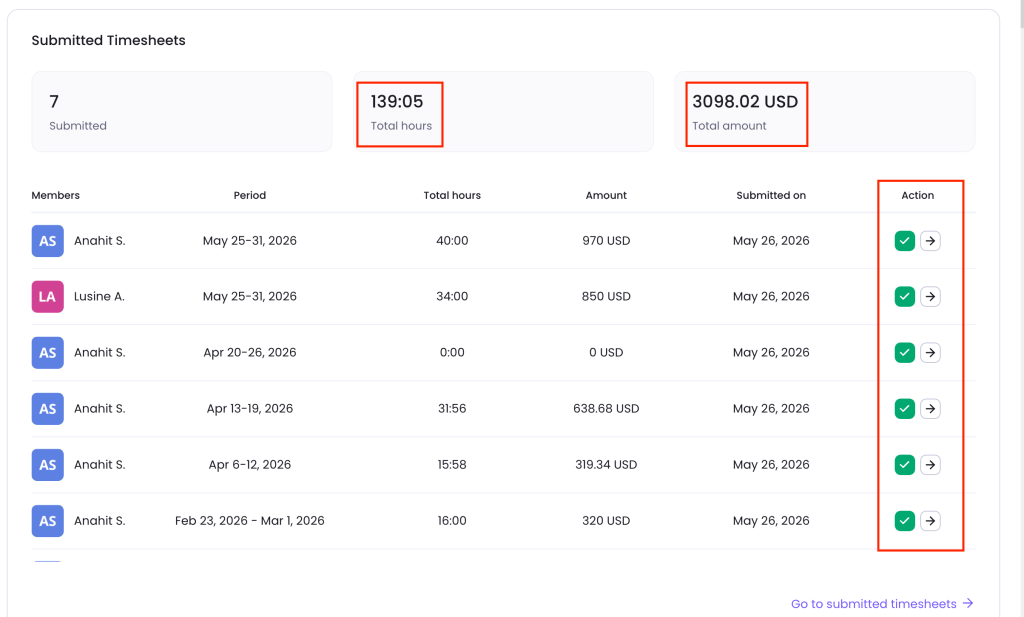
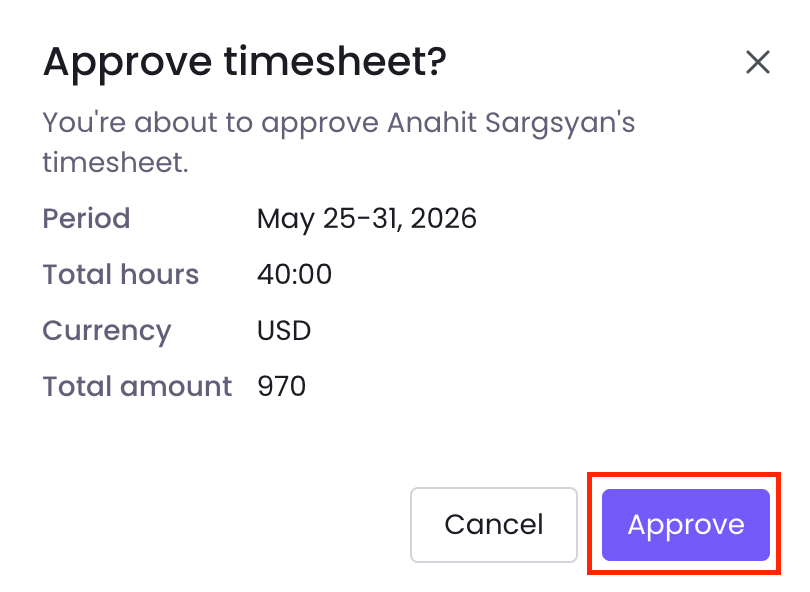
You can directly approve the timesheet from here. By clicking on the green checkmark button a pop-up appears about the details of the timesheet:
By clicking on the arrow button, you will be redirected to the Timesheet Approvals page.
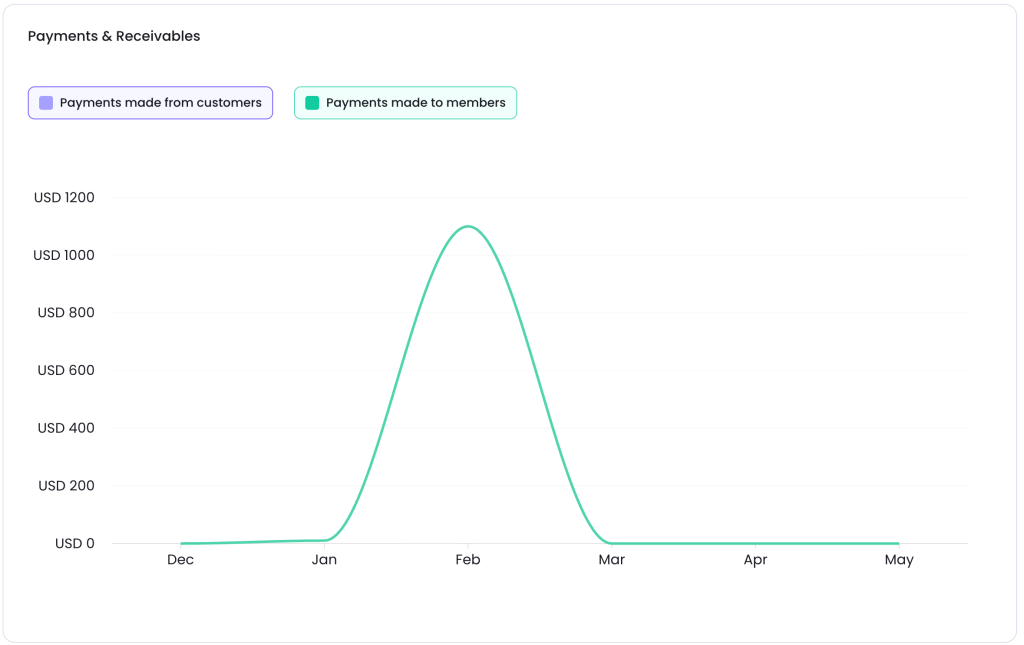
- Payments & Receivables – In this widget you can see the graph representation of the payments made to members or received from customers.
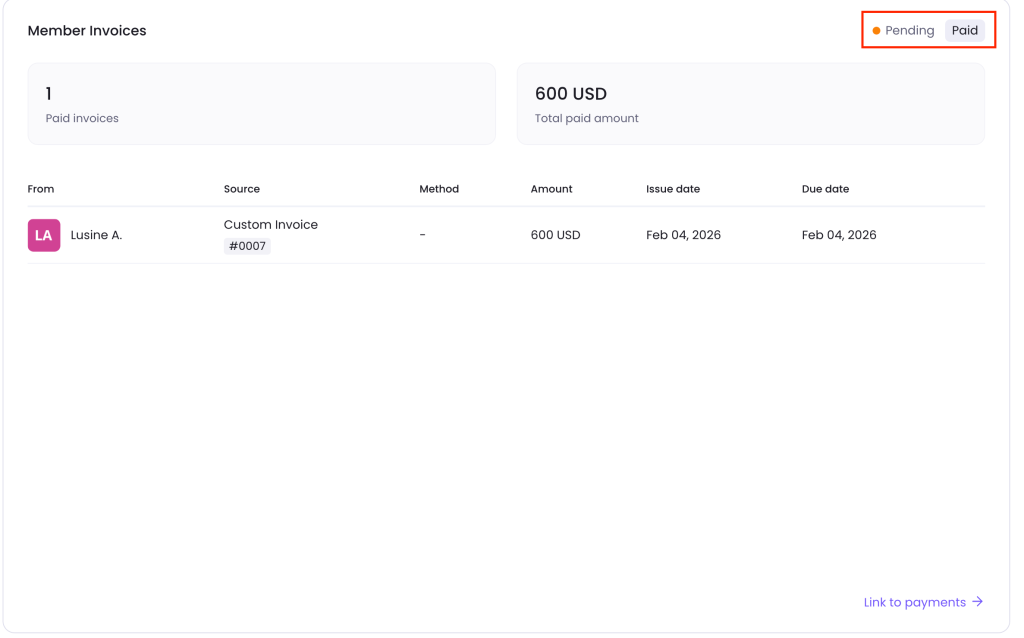
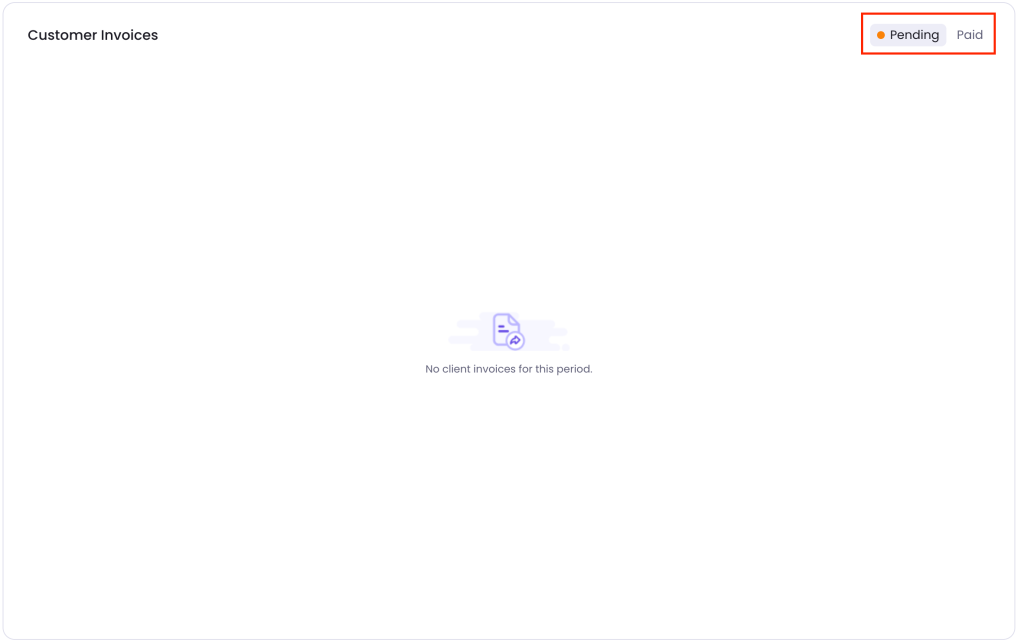
- Invoices – You can find the pending and paid invoices with the details about the amount, issue and due dates here. Both member and customer invoices are available
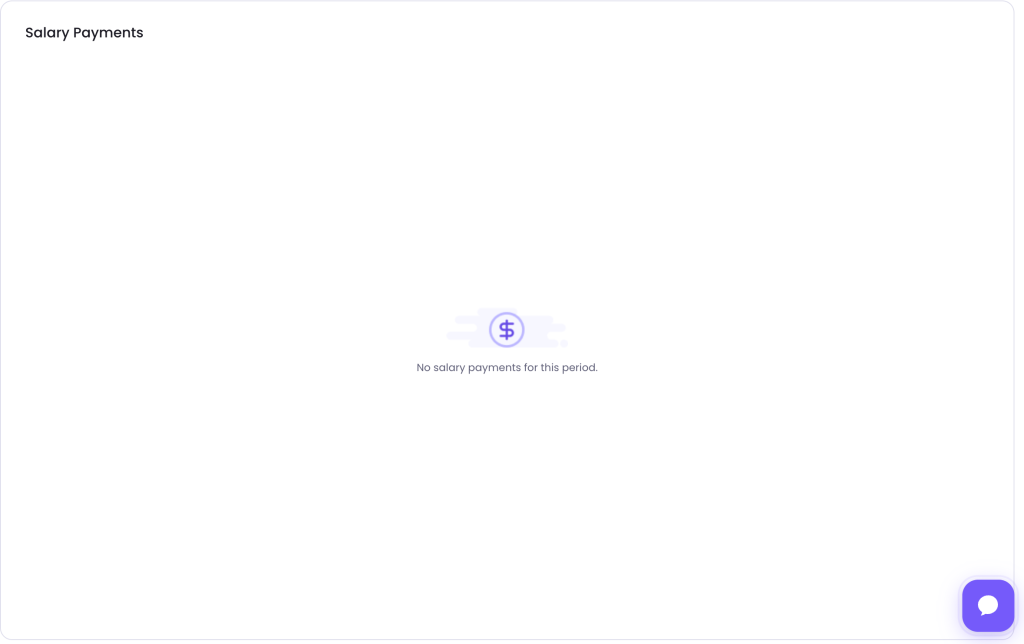
- Salary Payments – If you paid salaries you can see the information about the paid salaries in the following widget:
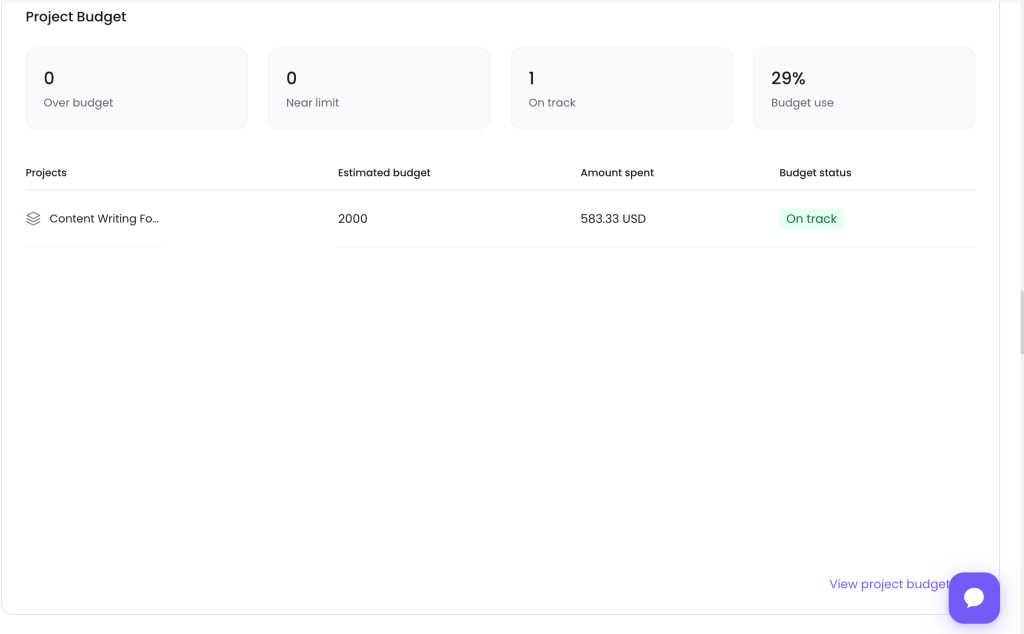
- Project Budget – In WebWork you can also put the budget expectations for each project and track how much was spent and whether you had a project overrun. This is also possible to see in the Finance Dashboard:
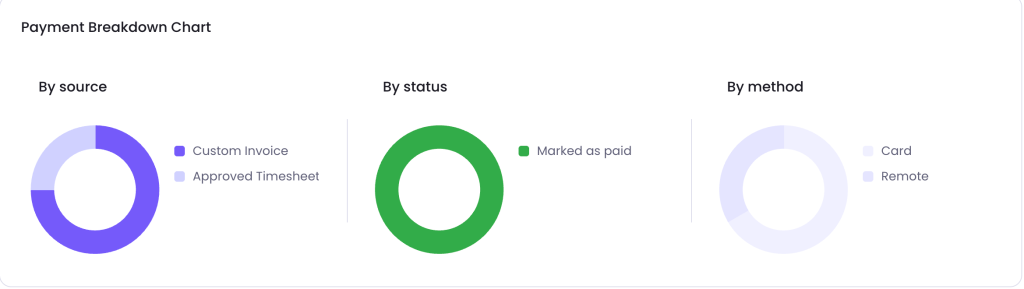
- Payments breakdown chart – Breakdown of your payments by status, source and method
- Expenses – Separate view for the expenses done within workspace. You can add new expenses from the Finance —> Expense Tracking section.
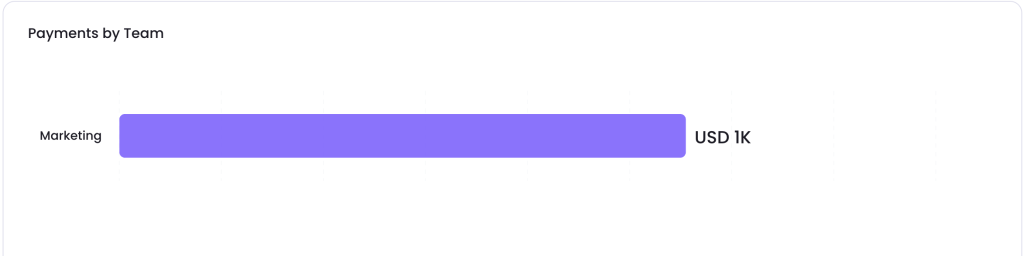
- Payments by team – All the payments team per team showcased in this section
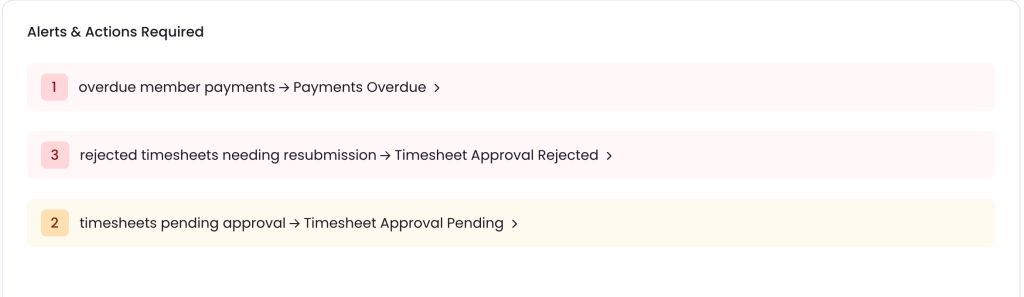
- Alerts and actions required – If you have priority tasks, such as approving pending timesheets, overdue payments, etc, you will also get such alerts in the relevant widgets.
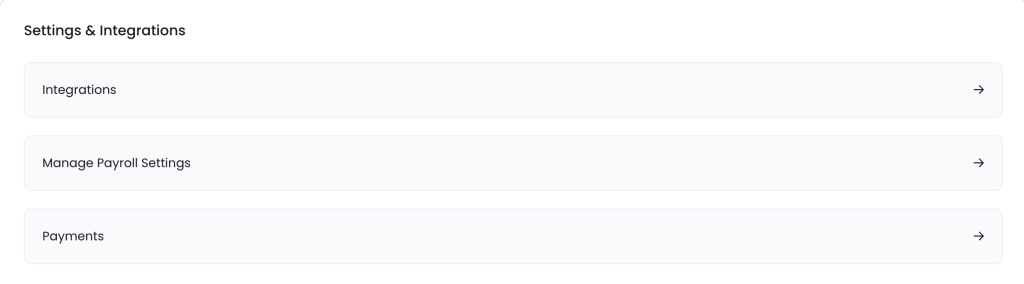
- Settings and integrations – This widgets allows you to directly move to the relevant sections, particularly the Integrations, Payroll or Payments settings.
Was this article helpful?
Thanks for your feedback.